J
Seller's Agent in 2014
Jessica Owens
Re/Max Of Albany

Estimated Value: $135,000 - $179,000
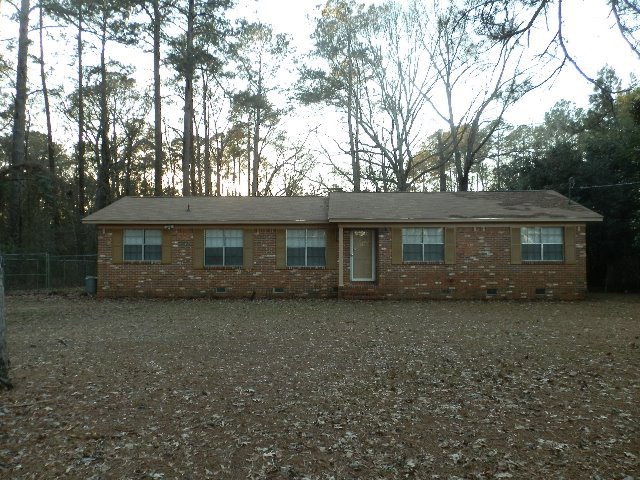
WHAT A GREAT BUY on a brick home just minutes from the marine base, P&G and Miller. Located in a quiet subdivision on spacious acre plus lot. Almost 1600 ft brick home that has been renovated beautifully! Brand new carpet, paint, fixtures and ceramic tile floors. Stunning kitchen with brand new cabinets and countertops that include lots of storage and an eat-at breakfast bar. Neat design kitchen with a brick fireplace that could be used as a eat-in dining area or a cozy den. Formal living room and formal dining room. 3 spacious bedrooms. 2 full baths with updated countertops and tiled shower. Large walk-in closet in the master suite. Enclosed bonus room that makes the perfect space for a playroom, office, sunroom or man cave. Large laundry room and utility room. Awesome and private 1 acre lot. This is a lot of house for the money! Call your agent to see this home TODAY!
Last Agent to Sell the Property
Jessica Owens
Re/Max Of Albany Brokerage Phone: 2294341600 Listed on: 04/29/2014
Last Buyer's Agent
Anneke Simmons
Addison Realty Co.
| Date | Buyer | Sale Price | Title Company |
|---|---|---|---|
| Izzi Betsy A | $66,500 | -- | |
| Forge Ahead Investors Lc | -- | -- | |
| Federal Home Loan Mortgage Corporation | $36,916 | -- | |
| Suntrust Mtg Inc | $36,916 | -- | |
| Bryan Christopher L | $67,000 | -- | |
| Wright Janet L | -- | -- | |
| Veterans Affairs | -- | -- | |
| Amsouth Mortgage Co Inc | -- | -- | |
| Gilletly Dennis | -- | -- |
| Date | Event | Price | List to Sale | Price per Sq Ft | Prior Sale |
|---|---|---|---|---|---|
| 05/15/2014 05/15/14 | Sold | $66,500 | +121.7% | $43 / Sq Ft | |
| 04/29/2014 04/29/14 | Pending | -- | -- | -- | |
| 04/12/2013 04/12/13 | Sold | $30,000 | -- | $19 / Sq Ft | View Prior Sale |
| 03/20/2013 03/20/13 | Pending | -- | -- | -- |
| Year | Tax Paid | Tax Assessment Tax Assessment Total Assessment is a certain percentage of the fair market value that is determined by local assessors to be the total taxable value of land and additions on the property. | Land | Improvement |
|---|---|---|---|---|
| 2025 | $1,377 | $34,188 | $2,160 | $32,028 |
| 2024 | $1,377 | $34,188 | $2,160 | $32,028 |
| 2023 | $1,581 | $34,188 | $2,160 | $32,028 |
| 2022 | $1,584 | $34,188 | $2,160 | $32,028 |
| 2021 | $1,467 | $34,188 | $2,160 | $32,028 |
| 2020 | $1,469 | $34,188 | $2,160 | $32,028 |
| 2019 | $1,472 | $34,188 | $2,160 | $32,028 |
| 2018 | $1,476 | $34,188 | $2,160 | $32,028 |
| 2017 | $1,374 | $34,188 | $2,160 | $32,028 |
| 2016 | $1,375 | $34,188 | $2,160 | $32,028 |
| 2015 | $1,071 | $29,628 | $2,160 | $27,468 |
| 2014 | $1,192 | $30,028 | $2,560 | $27,468 |
J
Seller's Agent in 2014
Jessica Owens
Re/Max Of Albany
A
Buyer's Agent in 2014
Anneke Simmons
Addison Realty Co.
A
Seller's Agent in 2013
Allan Willcox
Willcox Realty Company
(229) 886-2828
51 Total Sales
K
Buyer's Agent in 2013
KYLA STANDRING
Era All In One Realty
(229) 809-0494
15 Total Sales
Source: Albany Board of REALTORS®
MLS Number: 130754
APN: 00178-00001-021
Ask me questions while you tour the home.
