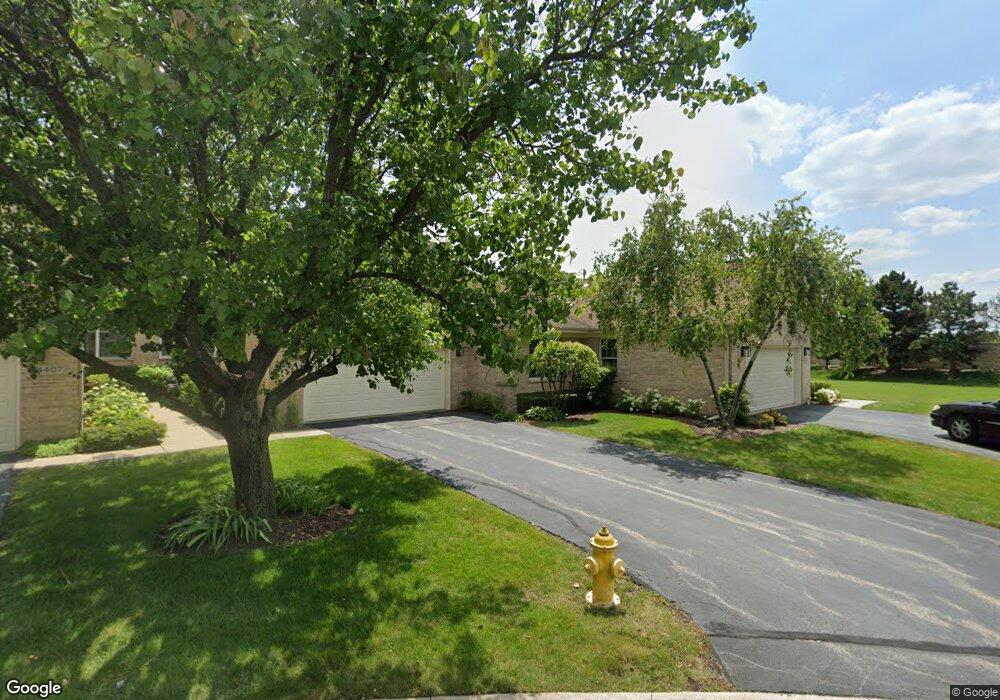
4411 Hammersmith Ln Glenview, IL 60026
Estimated Value: $510,990 - $660,000
3
Beds
2
Baths
2,010
Sq Ft
$282/Sq Ft
Est. Value
About This Home
This home is located at 4411 Hammersmith Ln, Glenview, IL 60026 and is currently estimated at $566,248, approximately $281 per square foot. 4411 Hammersmith Ln is a home located in Cook County with nearby schools including Henry Winkelman Elementary School, Field Middle School, and Glenbrook South High School.
Ownership History
Date
Name
Owned For
Owner Type
Purchase Details
Closed on
Dec 31, 2014
Sold by
Yokie Valerie
Bought by
Yokie Valerie B and The Valerie B Yokie Trust
Current Estimated Value
Purchase Details
Closed on
Dec 15, 2000
Sold by
Borre Beatrice R
Bought by
Yokie Valerie
Home Financials for this Owner
Home Financials are based on the most recent Mortgage that was taken out on this home.
Original Mortgage
$125,000
Interest Rate
7.83%
Purchase Details
Closed on
Apr 16, 1998
Sold by
American National Bk & Tr Co Of Chicago
Bought by
Borre Beatrice R
Home Financials for this Owner
Home Financials are based on the most recent Mortgage that was taken out on this home.
Original Mortgage
$95,000
Interest Rate
7.25%
Purchase Details
Closed on
Mar 28, 1994
Sold by
Lasalle National Trust Na
Bought by
Borre Robert and Borre Beatrice
Home Financials for this Owner
Home Financials are based on the most recent Mortgage that was taken out on this home.
Original Mortgage
$57,000
Interest Rate
7%
Create a Home Valuation Report for This Property
The Home Valuation Report is an in-depth analysis detailing your home's value as well as a comparison with similar homes in the area
Home Values in the Area
Average Home Value in this Area
Purchase History
| Date | Buyer | Sale Price | Title Company |
|---|---|---|---|
| Yokie Valerie B | -- | None Available | |
| Yokie Valerie | $345,000 | -- | |
| Borre Beatrice R | -- | -- | |
| Borre Robert | $199,333 | -- |
Source: Public Records
Mortgage History
| Date | Status | Borrower | Loan Amount |
|---|---|---|---|
| Closed | Yokie Valerie | $125,000 | |
| Previous Owner | Borre Beatrice R | $95,000 | |
| Previous Owner | Borre Robert | $57,000 |
Source: Public Records
Tax History
| Year | Tax Paid | Tax Assessment Tax Assessment Total Assessment is a certain percentage of the fair market value that is determined by local assessors to be the total taxable value of land and additions on the property. | Land | Improvement |
|---|---|---|---|---|
| 2025 | $4,769 | $48,000 | $12,566 | $35,434 |
| 2024 | $4,769 | $39,470 | $3,999 | $35,471 |
| 2023 | $4,892 | $39,470 | $3,999 | $35,471 |
| 2022 | $4,892 | $39,470 | $3,999 | $35,471 |
| 2021 | $5,523 | $33,290 | $4,435 | $28,855 |
| 2020 | $4,905 | $33,290 | $4,435 | $28,855 |
| 2019 | $4,791 | $37,405 | $4,435 | $32,970 |
| 2018 | $5,262 | $35,513 | $3,880 | $31,633 |
| 2017 | $5,022 | $35,513 | $3,880 | $31,633 |
| 2016 | $5,503 | $35,513 | $3,880 | $31,633 |
| 2015 | $6,387 | $31,693 | $3,141 | $28,552 |
| 2014 | $7,259 | $31,693 | $3,141 | $28,552 |
| 2013 | $6,095 | $31,693 | $3,141 | $28,552 |
Source: Public Records
Map
Nearby Homes
- 4408 Hammersmith Ln
- 3404 Salem Walk
- 3428 Salem Walk
- 3456 Salem Walk
- 2308 Indian Ridge Dr
- 3606 Salem Walk
- 3250 Sanders Rd Unit 10C
- 3246 Landwehr Rd Unit 3
- 3266 Sanders Rd Unit 6F
- 3190 Landwehr Rd
- 3856 S Parkway Dr Unit 3B
- 4142 Hampton Ct
- 4715 W Lake Ave
- 2501 Indian Ridge Dr
- 1594 Portage Run
- 3800 Kiess Dr
- 3240 Brookdale Ln
- 2803 Wildflower Ct
- 1223 Milwaukee Ave
- 3806 Michael Ln
- 4409 Hammersmith Ln
- 4407 Hammersmith Ln
- 4405 Hammersmith Ln
- 1924 Ivy Ln
- 4403 Hammersmith Ln
- 1926 Ivy Ln
- 1920 Ivy Ln
- 4414 Hammersmith Ln
- 4401 Hammersmith Ln
- 4412 Hammersmith Ln
- 4410 Hammersmith Ln
- 4406 Hammersmith Ln
- 1918 Ivy Ln
- 4404 Hammersmith Ln
- 4402 Hammersmith Ln
- 4402 Hammersmith Ln Unit 4402
- 1917 Ivy Ln
- 1916 Ivy Ln
- 1916 Ivy Ln
- 1915 Ivy Ln
Your Personal Tour Guide
Ask me questions while you tour the home.