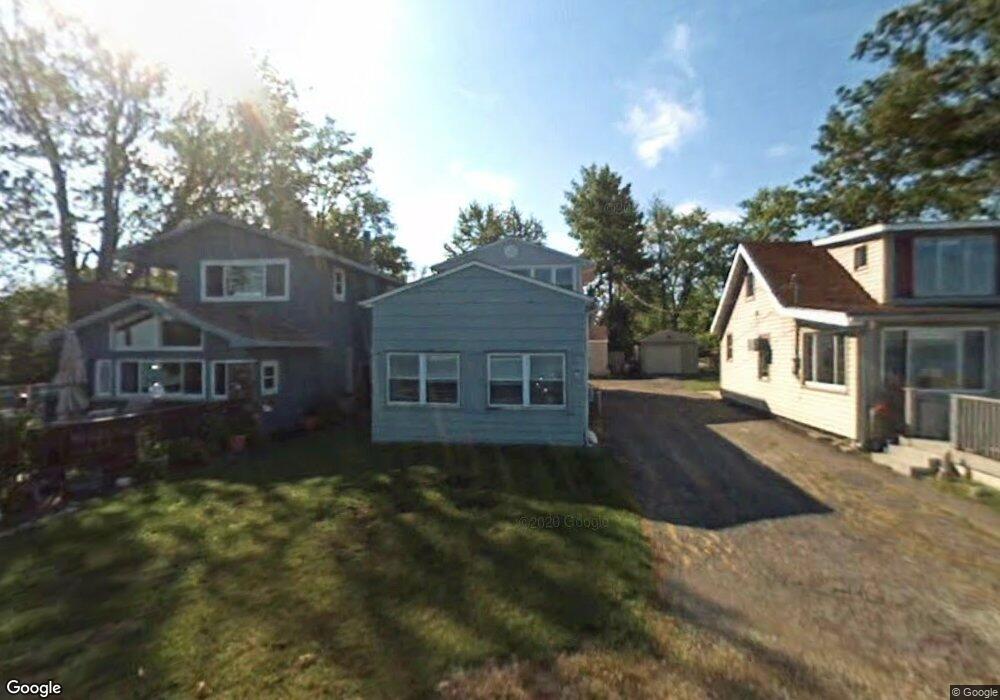
4412 Edgewater Dr Sheffield Lake, OH 44054
Estimated Value: $232,000 - $299,000
3
Beds
1
Bath
1,878
Sq Ft
$141/Sq Ft
Est. Value
About This Home
This home is located at 4412 Edgewater Dr, Sheffield Lake, OH 44054 and is currently estimated at $264,920, approximately $141 per square foot. 4412 Edgewater Dr is a home located in Lorain County with nearby schools including Knollwood Elementary School, Brookside Intermediate School, and Brookside Middle School.
Ownership History
Date
Name
Owned For
Owner Type
Purchase Details
Closed on
Apr 14, 2012
Sold by
Hackney Amy C
Bought by
Hackney Amy C and Hanchosky Lonnie J
Current Estimated Value
Home Financials for this Owner
Home Financials are based on the most recent Mortgage that was taken out on this home.
Original Mortgage
$116,000
Outstanding Balance
$15,678
Interest Rate
3.9%
Mortgage Type
New Conventional
Estimated Equity
$249,242
Purchase Details
Closed on
Jul 19, 2004
Sold by
Hanchosky James J and Hanchosky Mary Ann
Bought by
Hackney Amy C
Home Financials for this Owner
Home Financials are based on the most recent Mortgage that was taken out on this home.
Original Mortgage
$81,500
Interest Rate
6.4%
Mortgage Type
Purchase Money Mortgage
Purchase Details
Closed on
Jun 18, 2001
Sold by
Kalouria Jasbir S and Kalouria Tonia V
Bought by
Hanchosky James J and Hanchosky Mary Ann
Create a Home Valuation Report for This Property
The Home Valuation Report is an in-depth analysis detailing your home's value as well as a comparison with similar homes in the area
Home Values in the Area
Average Home Value in this Area
Purchase History
| Date | Buyer | Sale Price | Title Company |
|---|---|---|---|
| Hackney Amy C | -- | Guardian Title | |
| Hackney Amy C | $99,500 | Midland Title | |
| Hanchosky James J | $48,000 | -- |
Source: Public Records
Mortgage History
| Date | Status | Borrower | Loan Amount |
|---|---|---|---|
| Open | Hackney Amy C | $116,000 | |
| Closed | Hackney Amy C | $81,500 |
Source: Public Records
Tax History Compared to Growth
Tax History
| Year | Tax Paid | Tax Assessment Tax Assessment Total Assessment is a certain percentage of the fair market value that is determined by local assessors to be the total taxable value of land and additions on the property. | Land | Improvement |
|---|---|---|---|---|
| 2024 | $4,847 | $93,107 | $21,301 | $71,806 |
| 2023 | $4,814 | $81,298 | $28,756 | $52,542 |
| 2022 | $4,768 | $81,298 | $28,756 | $52,542 |
| 2021 | $4,796 | $81,298 | $28,756 | $52,542 |
| 2020 | $3,957 | $61,350 | $25,360 | $35,990 |
| 2019 | $3,933 | $61,350 | $25,360 | $35,990 |
| 2018 | $3,367 | $61,350 | $25,360 | $35,990 |
| 2017 | $2,786 | $39,560 | $11,450 | $28,110 |
| 2016 | $2,812 | $39,560 | $11,450 | $28,110 |
| 2015 | $2,242 | $31,880 | $11,450 | $20,430 |
| 2014 | $1,892 | $29,650 | $10,650 | $19,000 |
| 2013 | $1,883 | $29,650 | $10,650 | $19,000 |
Source: Public Records
Map
Nearby Homes
- 0 E Lake Rd
- 4502 Edgewater Dr
- 640 Pasadena Ave
- 580 Alameda Ave
- 644 Pasadena Ave
- 662 Kenilworth Ave
- 646 Dunny Ave
- 0 Kenilworth Ave
- 737 Dunny Ave
- 738 W Shore Blvd
- 762 Maplewood Ave
- 518 Lafayette Blvd
- 552 Treadway Blvd
- 630 Treadway Blvd
- 689 Lafayette Blvd
- VL Maplewood Ave
- 885 Lake Breeze Rd
- 4272 Brockley Ave
- 4260 Brockley Ave
- 4154 Belle Ave
- 4406 Edgewater Dr
- 4414 Edgewater Dr
- 4402 Edgewater Dr
- 4413 E Lake Rd
- 4426 Edgewater Dr
- 4424 Edgewater Dr
- 4395 E Lake Rd
- 4432 Edgewater Dr
- 4427 E Lake Rd
- 4391 E Lake Rd
- 4434 Edgewater Dr
- 4387 E Lake Rd
- 4402 E Lake Rd
- 4436 Edgewater Dr
- 4437 E Lake Rd
- 4385 E Lake Rd
- 4398 E Lake Rd
- 4418 E Lake Rd
- 4438 Edgewater Dr
- 4376 Edgewater Dr