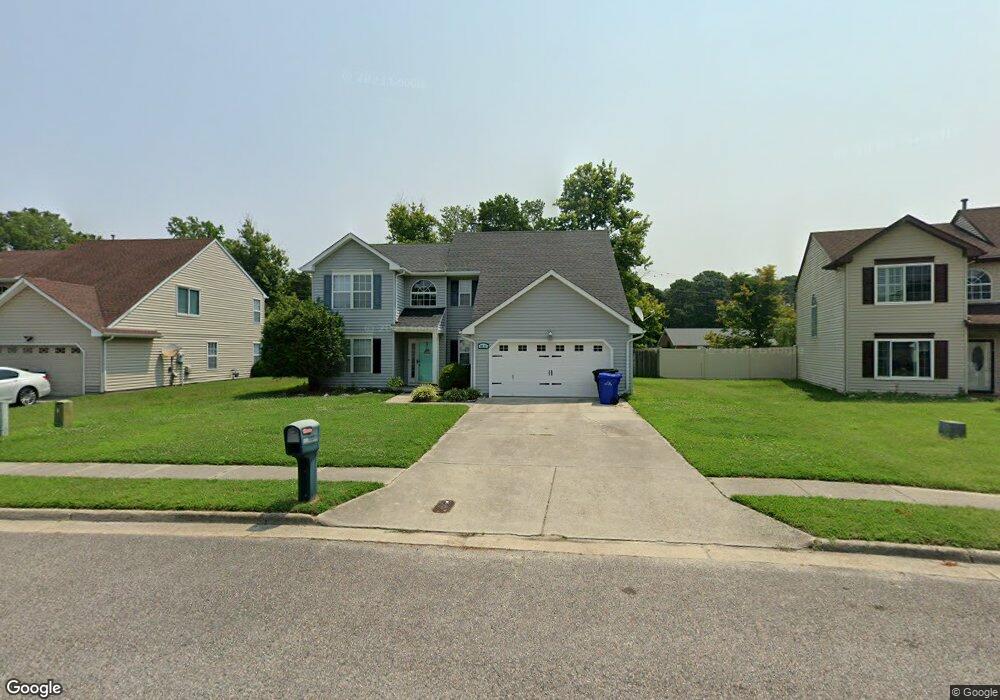
4413 Sedgewyck Ct Portsmouth, VA 23703
Churchland NeighborhoodEstimated Value: $423,000 - $443,000
4
Beds
3
Baths
2,537
Sq Ft
$171/Sq Ft
Est. Value
About This Home
This home is located at 4413 Sedgewyck Ct, Portsmouth, VA 23703 and is currently estimated at $433,121, approximately $170 per square foot. 4413 Sedgewyck Ct is a home located in Portsmouth City with nearby schools including Churchland Primary/Intermediate School, Churchland Middle School, and Churchland High School.
Ownership History
Date
Name
Owned For
Owner Type
Purchase Details
Closed on
Nov 3, 2022
Sold by
Sikiru Qladipo
Bought by
Nash Katrina Russell
Current Estimated Value
Home Financials for this Owner
Home Financials are based on the most recent Mortgage that was taken out on this home.
Original Mortgage
$380,030
Interest Rate
6.33%
Mortgage Type
Construction
Purchase Details
Closed on
Jul 20, 2015
Sold by
Federal National Mortgage Association
Bought by
Oladipo Sikiru
Home Financials for this Owner
Home Financials are based on the most recent Mortgage that was taken out on this home.
Original Mortgage
$237,590
Interest Rate
4.01%
Mortgage Type
VA
Purchase Details
Closed on
Jun 11, 2007
Sold by
Keeling John R
Bought by
Hardy Michael C
Home Financials for this Owner
Home Financials are based on the most recent Mortgage that was taken out on this home.
Original Mortgage
$236,000
Interest Rate
6.24%
Mortgage Type
New Conventional
Create a Home Valuation Report for This Property
The Home Valuation Report is an in-depth analysis detailing your home's value as well as a comparison with similar homes in the area
Home Values in the Area
Average Home Value in this Area
Purchase History
| Date | Buyer | Sale Price | Title Company |
|---|---|---|---|
| Nash Katrina Russell | $380,060 | Fidelity National Title | |
| Oladipo Sikiru | $230,000 | -- | |
| Hardy Michael C | $295,000 | -- |
Source: Public Records
Mortgage History
| Date | Status | Borrower | Loan Amount |
|---|---|---|---|
| Previous Owner | Nash Katrina Russell | $380,030 | |
| Previous Owner | Oladipo Sikiru | $237,590 | |
| Previous Owner | Hardy Michael C | $236,000 |
Source: Public Records
Tax History Compared to Growth
Tax History
| Year | Tax Paid | Tax Assessment Tax Assessment Total Assessment is a certain percentage of the fair market value that is determined by local assessors to be the total taxable value of land and additions on the property. | Land | Improvement |
|---|---|---|---|---|
| 2025 | $4,541 | $381,750 | $102,000 | $279,750 |
| 2024 | $4,541 | $369,220 | $102,000 | $267,220 |
| 2023 | $4,537 | $362,960 | $102,000 | $260,960 |
| 2022 | $4,145 | $318,820 | $85,000 | $233,820 |
| 2021 | $3,415 | $262,730 | $74,840 | $187,890 |
| 2020 | $3,369 | $259,170 | $71,280 | $187,890 |
| 2019 | $3,315 | $255,000 | $71,280 | $183,720 |
| 2018 | $3,315 | $255,000 | $71,280 | $183,720 |
| 2017 | $3,233 | $248,730 | $71,280 | $177,450 |
| 2016 | $3,233 | $248,730 | $71,280 | $177,450 |
| 2015 | $3,233 | $248,730 | $71,280 | $177,450 |
| 2014 | $3,159 | $248,730 | $71,280 | $177,450 |
Source: Public Records
Map
Nearby Homes
- 4200 Quince Rd
- 4224 Burnham Dr
- 5807 Dunkin St
- 4100 Mayfair Way
- 5833 Hawthorne Ln
- 4232 Summerset Dr
- 4028 Swannanoa Dr
- 5728 Hawthorne Ln
- 3433 Willow Breeze Dr
- 8 Compass Ct
- 21 Windy Pines Crescent
- 17 Shoal Ct
- 4444 Southampton Arch
- 3866 Augustine Cir
- 3860 Sugar Creek Cir
- 5606 Gregory Ct
- 4071 Long Point Blvd
- 4008 Oakhurst Rd
- 3818 Peach Orchard Cir
- 3877 Peachtree Ln W
- 4413 Sedgewyck Cir
- 4407 Sedgewyck Cir
- 4419 Sedgewyck Cir
- 4401 Sedgewyck Cir
- 4420 Sedgewyck Cir
- 4425 Sedgewyck Cir
- 4412 Sedgewyck Ct
- 4342 Sedgewyck Ct
- 4420 Sedgewyck Ct
- 4404 Sedgewyck Ct
- 4404 Sedgewyck Cir
- 4433 Sedgewyck Ct
- 4428 Sedgewyck Ct
- 4326 Sedgewyck Cir
- 4209 Twin Pines Rd
- 4436 Sedgewyck Cir
- 4346 Sedgewyck Ct
- 4343 Sedgewyck Ct
- 4331 Sedgewyck Cir
- 4335 Sedgewyck Ct