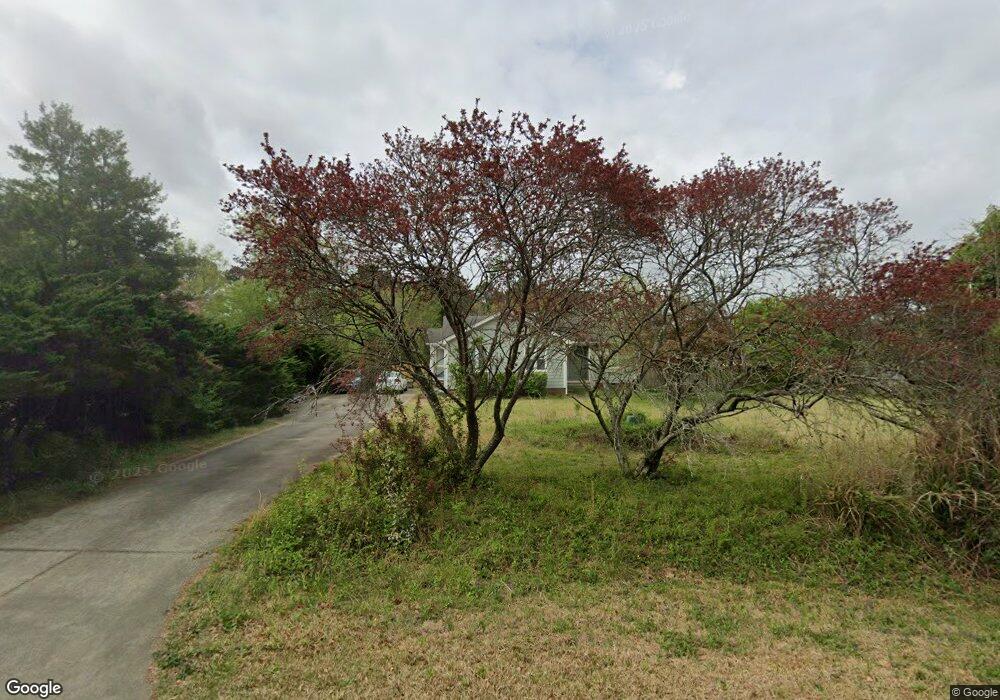
4413 Twig Ct Apex, NC 27539
Middle Creek NeighborhoodEstimated Value: $355,000 - $373,000
3
Beds
2
Baths
1,241
Sq Ft
$291/Sq Ft
Est. Value
About This Home
This home is located at 4413 Twig Ct, Apex, NC 27539 and is currently estimated at $361,209, approximately $291 per square foot. 4413 Twig Ct is a home located in Wake County with nearby schools including West Lake Elementary School, West Lake Middle, and Middle Creek High.
Ownership History
Date
Name
Owned For
Owner Type
Purchase Details
Closed on
Aug 10, 2012
Sold by
Middleton Paul D and Middleton Shanna
Bought by
Burleson Brian F and Godwin Anna K
Current Estimated Value
Home Financials for this Owner
Home Financials are based on the most recent Mortgage that was taken out on this home.
Original Mortgage
$119,072
Outstanding Balance
$18,084
Interest Rate
2.75%
Mortgage Type
FHA
Estimated Equity
$343,125
Purchase Details
Closed on
Apr 17, 2012
Sold by
Wells Fargo Bank National Association
Bought by
Middleton Paul D
Purchase Details
Closed on
Sep 7, 2011
Sold by
Ingram Cathryn W and Ingram Paul Roger
Bought by
Wells Fargo Bank National Association
Purchase Details
Closed on
Sep 8, 1998
Sold by
Jackson Rodney C
Bought by
Ingram Paul Roger and Ingram Cathryn W
Home Financials for this Owner
Home Financials are based on the most recent Mortgage that was taken out on this home.
Original Mortgage
$100,000
Interest Rate
6.99%
Create a Home Valuation Report for This Property
The Home Valuation Report is an in-depth analysis detailing your home's value as well as a comparison with similar homes in the area
Home Values in the Area
Average Home Value in this Area
Purchase History
| Date | Buyer | Sale Price | Title Company |
|---|---|---|---|
| Burleson Brian F | $151,000 | None Available | |
| Middleton Paul D | $81,000 | None Available | |
| Wells Fargo Bank National Association | $132,000 | None Available | |
| Ingram Paul Roger | -- | -- | |
| Ingram Paul Roger | $105,000 | -- |
Source: Public Records
Mortgage History
| Date | Status | Borrower | Loan Amount |
|---|---|---|---|
| Open | Burleson Brian F | $119,072 | |
| Previous Owner | Ingram Paul Roger | $100,000 |
Source: Public Records
Tax History
| Year | Tax Paid | Tax Assessment Tax Assessment Total Assessment is a certain percentage of the fair market value that is determined by local assessors to be the total taxable value of land and additions on the property. | Land | Improvement |
|---|---|---|---|---|
| 2025 | $1,998 | $309,201 | $130,000 | $179,201 |
| 2024 | $1,940 | $309,201 | $130,000 | $179,201 |
Source: Public Records
Map
Nearby Homes
- 8801 Valley Hill Ct
- 8224 Bells Lake Rd
- 8220 Bells Lake Rd
- 4004 Old Sturbridge Dr
- 4412 Fairview Ridge Ln
- 8313 Covington Hill Way
- 5004 Rustler Ct
- 4912 Overeasy Dr
- 5012 Rustler Ct
- 5008 Rustler Ct
- 4913 Mashpee Ln
- 4908 Dr
- 5024 Overeasy Dr
- 273 Meadow Beauty Dr
- 5045 Homeplace Dr
- 5153 Dove Forest Ln
- 5032 Overeasy Dr
- 7243 Capulin Crest Dr
- 5033 Overeasy Dr
- 5028 Overeasy Dr
- 4409 Twig Ct
- 8601 Manns Loop Rd
- 8537 Manns Loop Rd
- 4405 Twig Ct
- 8609 Manns Loop Rd
- 4412 Twig Ct
- 4401 Twig Ct
- 4416 Twig Ct
- 4400 Twig Ct
- 8525 Manns Loop Rd
- 8629 Manns Loop Rd
- 8532 Manns Loop Rd
- 8600 Manns Loop Rd
- 4404 Mannsfield Ct
- 8604 Manns Loop Rd
- 4408 Mannsfield Ct
- 8524 Manns Loop Rd
- 4400 Mannsfield Ct
- 8521 Manns Loop Rd
- 8608 Manns Loop Rd
Your Personal Tour Guide
Ask me questions while you tour the home.