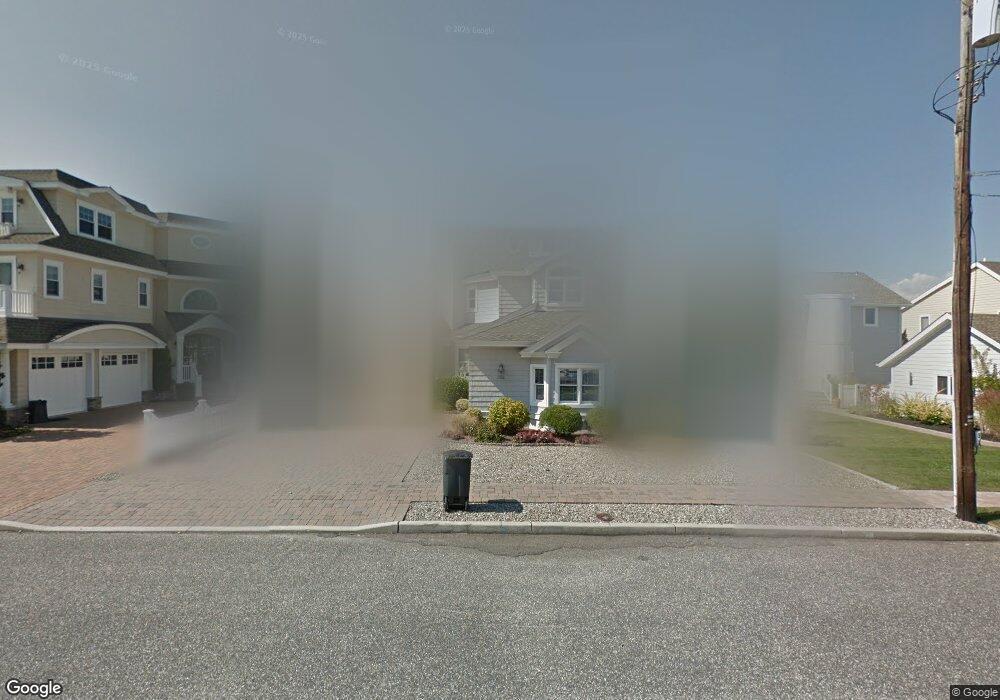
4414 5th Ave Avalon, NJ 08202
Estimated Value: $6,657,000 - $7,574,152
--
Bed
--
Bath
4,729
Sq Ft
$1,532/Sq Ft
Est. Value
About This Home
This home is located at 4414 5th Ave, Avalon, NJ 08202 and is currently estimated at $7,242,717, approximately $1,531 per square foot. 4414 5th Ave is a home located in Cape May County with nearby schools including Avalon Elementary School.
Ownership History
Date
Name
Owned For
Owner Type
Purchase Details
Closed on
Sep 17, 2024
Sold by
Caracausa David J
Bought by
David J Caracausa Irrevocable Trust and Caracausa
Current Estimated Value
Purchase Details
Closed on
Sep 16, 2024
Sold by
Caracausa David J and Caracausa Karen E
Bought by
Caracausa David J
Purchase Details
Closed on
Sep 11, 2002
Sold by
Takema Ltd Lp
Bought by
Caracausa David J and Caracausa Karen E
Purchase Details
Closed on
Jan 29, 1997
Sold by
Warren John H
Bought by
Takema Ltd Lp
Home Financials for this Owner
Home Financials are based on the most recent Mortgage that was taken out on this home.
Original Mortgage
$432,000
Interest Rate
7.57%
Purchase Details
Closed on
May 15, 1991
Sold by
New Jersey Dep
Bought by
Warren John H and Warren Evelyn W
Create a Home Valuation Report for This Property
The Home Valuation Report is an in-depth analysis detailing your home's value as well as a comparison with similar homes in the area
Home Values in the Area
Average Home Value in this Area
Purchase History
| Date | Buyer | Sale Price | Title Company |
|---|---|---|---|
| David J Caracausa Irrevocable Trust | -- | None Listed On Document | |
| David J Caracausa Irrevocable Trust | -- | None Listed On Document | |
| Caracausa David J | -- | None Listed On Document | |
| Caracausa David J | -- | None Listed On Document | |
| Caracausa David J | $1,065,000 | -- | |
| Takema Ltd Lp | $540,000 | -- | |
| Warren John H | $43,400 | -- |
Source: Public Records
Mortgage History
| Date | Status | Borrower | Loan Amount |
|---|---|---|---|
| Previous Owner | Takema Ltd Lp | $432,000 |
Source: Public Records
Tax History Compared to Growth
Tax History
| Year | Tax Paid | Tax Assessment Tax Assessment Total Assessment is a certain percentage of the fair market value that is determined by local assessors to be the total taxable value of land and additions on the property. | Land | Improvement |
|---|---|---|---|---|
| 2025 | $24,400 | $3,973,900 | $2,400,000 | $1,573,900 |
| 2024 | $24,400 | $3,973,900 | $2,400,000 | $1,573,900 |
| 2023 | $24,201 | $3,973,900 | $2,400,000 | $1,573,900 |
| 2022 | $22,572 | $3,973,900 | $2,400,000 | $1,573,900 |
| 2021 | $15,136 | $3,973,900 | $2,400,000 | $1,573,900 |
| 2020 | $20,903 | $3,973,900 | $2,400,000 | $1,573,900 |
| 2019 | $20,267 | $3,973,900 | $2,400,000 | $1,573,900 |
| 2018 | $19,393 | $3,973,900 | $2,400,000 | $1,573,900 |
| 2017 | $17,398 | $3,129,100 | $1,700,000 | $1,429,100 |
| 2016 | $17,210 | $3,129,100 | $1,700,000 | $1,429,100 |
| 2015 | $16,928 | $3,129,100 | $1,700,000 | $1,429,100 |
| 2014 | $16,741 | $3,129,100 | $1,700,000 | $1,429,100 |
Source: Public Records
Map
Nearby Homes