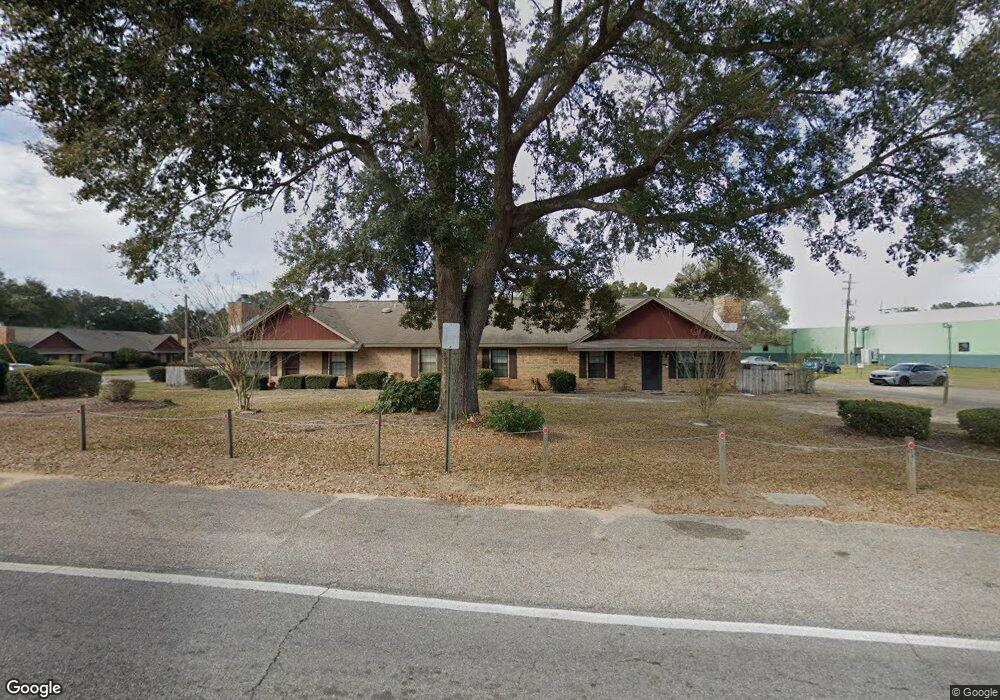
4414 Bellview Ave Unit 2D Pensacola, FL 32526
Estimated Value: $144,000 - $154,707
--
Bed
2
Baths
990
Sq Ft
$151/Sq Ft
Est. Value
About This Home
This home is located at 4414 Bellview Ave Unit 2D, Pensacola, FL 32526 and is currently estimated at $149,927, approximately $151 per square foot. 4414 Bellview Ave Unit 2D is a home located in Escambia County with nearby schools including Bellview Elementary School, Bellview Middle School, and Pine Forest High School.
Ownership History
Date
Name
Owned For
Owner Type
Purchase Details
Closed on
May 5, 2015
Sold by
Vanlandingham Hazel Y
Bought by
Vanlandingham Stephen C and Vanlandingham Patricia D
Current Estimated Value
Purchase Details
Closed on
Jul 8, 2014
Sold by
Vanlandingham Hazel Y
Bought by
Vanlandingham Hazel Y and Vanlandingham Stephen C
Purchase Details
Closed on
Jun 10, 2014
Sold by
Vanlandingham Woodrow
Bought by
Vanlandingham Hazel Y
Purchase Details
Closed on
Jun 2, 2014
Sold by
Harrison Kay V
Bought by
Vanlandingham Hazel Y
Purchase Details
Closed on
Nov 13, 2013
Sold by
Vanlandingham Hazel Y
Bought by
Vanlandingham Hazel Y and Vanlandingham Woodrow
Purchase Details
Closed on
Jan 19, 2006
Sold by
Vanlandingham Woodrow and Harrison Kay V
Bought by
Vanlandingham Hazel Y
Purchase Details
Closed on
Jun 21, 2004
Sold by
Key John and Key Dorothy
Bought by
Vanlandingham Hazel Y and Vanlandingham Woodrow
Create a Home Valuation Report for This Property
The Home Valuation Report is an in-depth analysis detailing your home's value as well as a comparison with similar homes in the area
Home Values in the Area
Average Home Value in this Area
Purchase History
| Date | Buyer | Sale Price | Title Company |
|---|---|---|---|
| Vanlandingham Stephen C | $15,000 | None Available | |
| Vanlandingham Hazel Y | $15,100 | None Available | |
| Vanlandingham Hazel Y | $15,100 | None Available | |
| Vanlandingham Hazel Y | $15,100 | None Available | |
| Vanlandingham Hazel Y | -- | None Available | |
| Vanlandingham Hazel Y | -- | Attorney | |
| Vanlandingham Hazel Y | $58,000 | Reliable Land Title Corp |
Source: Public Records
Tax History Compared to Growth
Tax History
| Year | Tax Paid | Tax Assessment Tax Assessment Total Assessment is a certain percentage of the fair market value that is determined by local assessors to be the total taxable value of land and additions on the property. | Land | Improvement |
|---|---|---|---|---|
| 2024 | $468 | $53,674 | -- | -- |
| 2023 | $468 | $52,111 | $0 | $0 |
| 2022 | $463 | $50,594 | $0 | $0 |
| 2021 | $459 | $49,121 | $0 | $0 |
| 2020 | $445 | $48,443 | $0 | $0 |
| 2019 | $432 | $47,354 | $0 | $0 |
| 2018 | $426 | $46,472 | $0 | $0 |
| 2017 | $419 | $45,517 | $0 | $0 |
| 2016 | $411 | $44,581 | $0 | $0 |
| 2015 | $821 | $48,679 | $0 | $0 |
| 2014 | $825 | $49,285 | $0 | $0 |
Source: Public Records
Map
Nearby Homes
- 4436 Bellview Ave Unit 5
- 1003 Simpson St
- 1009 Simpson St
- 1015 Simpson St
- 2009 Sequoia Cir
- 2016 Sequoia Cir
- 1614 Galvin Ave
- 1111 Simpson St
- 1123 Simpson St
- 6036 Royal Port Ct
- 6033 Champion Oaks Dr
- 1152 Simpson St
- 6008 Royal Port Ct
- 6004 Royal Port Ct
- 6320 Clegg Rd
- 5000 Stevendale Rd
- 6625 Dallas Ave
- 5142 Stevendale Rd
- 6173 Native Dancer Way
- 6177 Native Dancer Way
- 4416 Bellview Ave Unit 2C
- 4412 Bellview Ave Unit 2A
- 4408 Bellview Ave Unit 1C
- 4406 Bellview Ave Unit 1D
- 4406 Bellview Ave Unit 10
- 4404 Bellview Ave Unit 1A
- 4402 Bellview Ave Unit 1B
- 4418 Bellview Ave Unit 3B
- 4452 Bellview Ave Unit 7A
- 4450 Bellview Ave Unit 7B
- 4422 Bellview Ave Unit 3-D
- 4420 Bellview Ave Unit 3-A
- 4420 Bellview Ave
- 4456 Bellview Ave Unit C
- 4456 Bellview Ave Unit 7C
- 4456 Bellview Ave
- 4458 Bellview Ave Unit 8D
- 4458 Bellview Ave
- 4462 Bellview Ave
- 4454 Bellview Ave