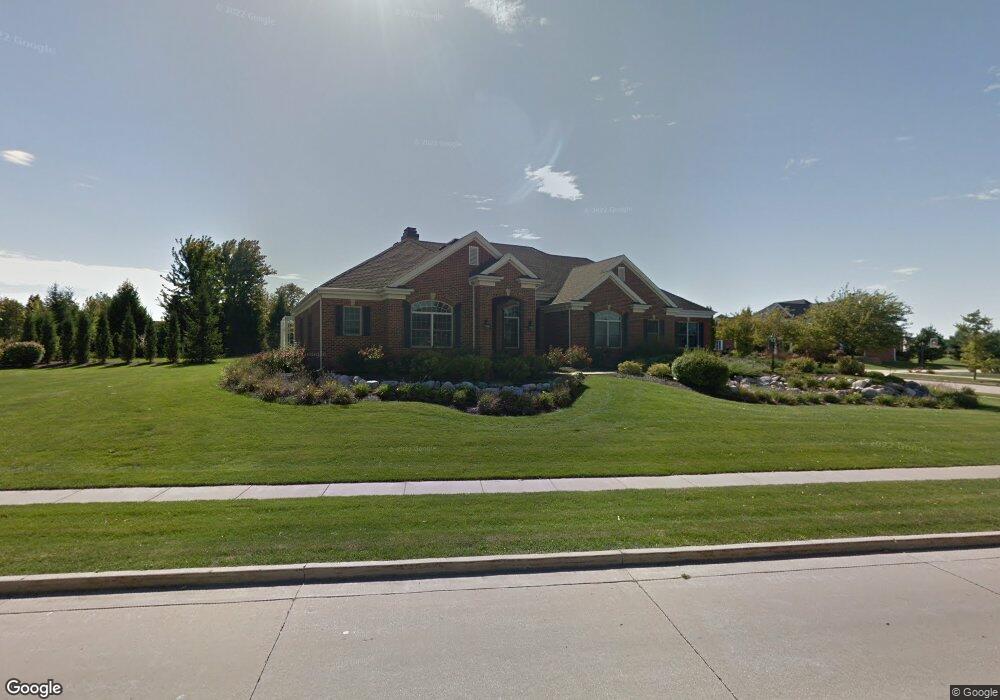
4414 Trostshire Cir Champaign, IL 61822
Estimated Value: $656,000 - $716,000
5
Beds
4
Baths
2,680
Sq Ft
$256/Sq Ft
Est. Value
About This Home
This home is located at 4414 Trostshire Cir, Champaign, IL 61822 and is currently estimated at $685,631, approximately $255 per square foot. 4414 Trostshire Cir is a home located in Champaign County with nearby schools including Centennial High School, Countryside School, and Swann Special Care Center-Elem/Secondary School.
Ownership History
Date
Name
Owned For
Owner Type
Purchase Details
Closed on
Aug 20, 2021
Sold by
Troutt Janice Elaine and Janice Elaine Troutt Trust
Bought by
Michaelson Robert J and Michaelson Debra S
Current Estimated Value
Home Financials for this Owner
Home Financials are based on the most recent Mortgage that was taken out on this home.
Original Mortgage
$432,000
Outstanding Balance
$392,230
Interest Rate
2.8%
Mortgage Type
New Conventional
Estimated Equity
$293,401
Purchase Details
Closed on
Aug 31, 2011
Sold by
Troutt Janice Elaine
Bought by
Troutt Janice Elaine
Purchase Details
Closed on
Jun 13, 2008
Sold by
Troutt H Fred
Bought by
Troutt H Fred and Troutt Janice Elaine
Purchase Details
Closed on
Oct 15, 2004
Sold by
Bankillinois
Bought by
H Fred Troutt Residence Trust
Home Financials for this Owner
Home Financials are based on the most recent Mortgage that was taken out on this home.
Original Mortgage
$333,700
Interest Rate
4.62%
Mortgage Type
Purchase Money Mortgage
Create a Home Valuation Report for This Property
The Home Valuation Report is an in-depth analysis detailing your home's value as well as a comparison with similar homes in the area
Home Values in the Area
Average Home Value in this Area
Purchase History
| Date | Buyer | Sale Price | Title Company |
|---|---|---|---|
| Michaelson Robert J | $540,000 | None Available | |
| Troutt Janice Elaine | -- | None Available | |
| Troutt H Fred | -- | None Available | |
| H Fred Troutt Residence Trust | $559,500 | Allied Title Services |
Source: Public Records
Mortgage History
| Date | Status | Borrower | Loan Amount |
|---|---|---|---|
| Open | Michaelson Robert J | $432,000 | |
| Previous Owner | H Fred Troutt Residence Trust | $333,700 |
Source: Public Records
Tax History Compared to Growth
Tax History
| Year | Tax Paid | Tax Assessment Tax Assessment Total Assessment is a certain percentage of the fair market value that is determined by local assessors to be the total taxable value of land and additions on the property. | Land | Improvement |
|---|---|---|---|---|
| 2024 | $16,553 | $208,380 | $43,860 | $164,520 |
| 2023 | $16,553 | $192,410 | $40,500 | $151,910 |
| 2022 | $15,710 | $179,490 | $37,780 | $141,710 |
| 2021 | $15,332 | $176,310 | $37,110 | $139,200 |
| 2020 | $15,187 | $174,560 | $36,740 | $137,820 |
| 2019 | $14,730 | $171,650 | $36,130 | $135,520 |
| 2018 | $17,043 | $197,180 | $36,130 | $161,050 |
| 2017 | $16,694 | $193,160 | $36,130 | $157,030 |
| 2016 | $15,301 | $193,160 | $36,130 | $157,030 |
| 2015 | $15,680 | $193,160 | $36,130 | $157,030 |
| 2014 | $15,988 | $193,160 | $36,130 | $157,030 |
| 2013 | $15,848 | $193,160 | $36,130 | $157,030 |
Source: Public Records
Map
Nearby Homes
- 4703 W Kirby Ave
- 1504 Wyndemere Point Dr
- 4700 Chestnut Grove Dr
- 4203 Curtis Meadow Dr
- 4410 Southford Trace Dr
- 1503 English Oak Dr
- 1904 Mullikin Dr
- 1621 English Oak Dr
- 4406 Crossgate Dr
- 1211 English Oak Dr
- 5021 Chestnut Grove Dr
- 4007 Turnberry Dr
- 4004 Golf Creek Dr
- 1806 Bentbrook Dr
- 2004 Emerald Dr
- 5017 Trey Blvd
- 5016 Trey Blvd
- 1103 Prestwick Point
- 1108 Glen Abbey Dr
- 4103 Crail Rd
- 4412 Trostshire Cir
- 4411 Curtis Meadow Dr
- 1603 Mullikin Dr
- 4413 Trostshire Cir
- 1605 Mullikin Dr
- 4411 Trostshire Cir
- 4410 Trostshire Cir
- 4409 Curtis Meadow Dr
- 1601 Mullikin Dr
- 1607 Mullikin Dr
- 4407 Trostshire Cir
- 1610 Mullikin Dr
- 4407 Curtis Meadow Dr
- 4408 Trostshire Cir
- 4412 Curtis Meadow Dr
- 1609 Mullikin Dr
- 1600 Mullikin Dr
- 4410 Curtis Meadow Dr
- 4406 Trostshire Cir
- 4408 Curtis Meadow Dr