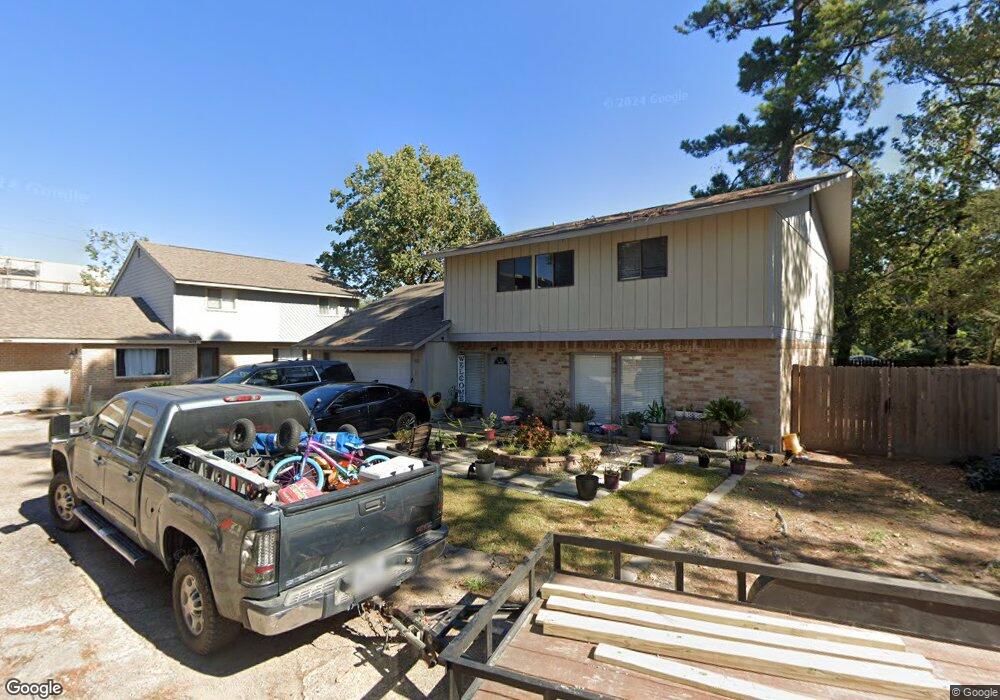
4414 W Cypress Villas Dr Spring, TX 77379
Champions NeighborhoodEstimated Value: $207,000 - $232,596
4
Beds
3
Baths
2,104
Sq Ft
$105/Sq Ft
Est. Value
About This Home
This home is located at 4414 W Cypress Villas Dr, Spring, TX 77379 and is currently estimated at $221,649, approximately $105 per square foot. 4414 W Cypress Villas Dr is a home located in Harris County with nearby schools including Benfer Elementary School, Strack Intermediate School, and Klein High School.
Ownership History
Date
Name
Owned For
Owner Type
Purchase Details
Closed on
Aug 6, 2020
Sold by
K179 Huntington Trust
Bought by
Cortez Jose Hector and Gaytan Vidala J
Current Estimated Value
Home Financials for this Owner
Home Financials are based on the most recent Mortgage that was taken out on this home.
Original Mortgage
$131,900
Interest Rate
6.33%
Mortgage Type
Seller Take Back
Purchase Details
Closed on
Dec 16, 1999
Sold by
Burnside Rosemary M
Bought by
Thomas Rhonda
Home Financials for this Owner
Home Financials are based on the most recent Mortgage that was taken out on this home.
Original Mortgage
$77,957
Interest Rate
7.71%
Mortgage Type
FHA
Purchase Details
Closed on
Feb 19, 1997
Sold by
Burnside Robert S
Bought by
Burnside Rosemary M
Home Financials for this Owner
Home Financials are based on the most recent Mortgage that was taken out on this home.
Original Mortgage
$61,397
Interest Rate
7.92%
Create a Home Valuation Report for This Property
The Home Valuation Report is an in-depth analysis detailing your home's value as well as a comparison with similar homes in the area
Home Values in the Area
Average Home Value in this Area
Purchase History
| Date | Buyer | Sale Price | Title Company |
|---|---|---|---|
| Cortez Jose Hector | -- | -- | |
| Thomas Rhonda | -- | First American Title | |
| Burnside Rosemary M | -- | -- |
Source: Public Records
Mortgage History
| Date | Status | Borrower | Loan Amount |
|---|---|---|---|
| Previous Owner | Cortez Jose Hector | $131,900 | |
| Previous Owner | Thomas Rhonda | $77,957 | |
| Previous Owner | Burnside Rosemary M | $61,397 |
Source: Public Records
Tax History Compared to Growth
Tax History
| Year | Tax Paid | Tax Assessment Tax Assessment Total Assessment is a certain percentage of the fair market value that is determined by local assessors to be the total taxable value of land and additions on the property. | Land | Improvement |
|---|---|---|---|---|
| 2025 | $3,913 | $157,252 | $45,773 | $111,479 |
| 2024 | $3,913 | $183,581 | $45,773 | $137,808 |
| 2023 | $3,913 | $194,200 | $45,773 | $148,427 |
| 2022 | $3,854 | $170,300 | $45,773 | $124,527 |
| 2021 | $2,663 | $110,276 | $24,412 | $85,864 |
| 2020 | $2,393 | $95,000 | $24,412 | $70,588 |
| 2019 | $2,488 | $95,000 | $24,412 | $70,588 |
| 2018 | $1,218 | $85,200 | $24,412 | $60,788 |
| 2017 | $1,915 | $73,000 | $24,412 | $48,588 |
| 2016 | $1,768 | $67,400 | $18,309 | $49,091 |
| 2015 | $1,743 | $67,401 | $18,309 | $49,092 |
| 2014 | $1,743 | $67,401 | $18,309 | $49,092 |
Source: Public Records
Map
Nearby Homes
- 17833 S Cypress Villas Dr
- 18023 Woodgum Dr
- 4826 Casemont Dr
- 4807 Coltwood Dr
- 18022 Blundell Dr
- 18011 Tall Cypress Dr
- 17910 W Strack Dr
- 4723 Lost Oak Dr
- 4223 Annawood Cir
- 17427 W Strack Dr
- 17910 Loring Ln
- 4070 Coltwood Dr
- 4034 Rolling Terrace Dr
- 4126 Oxhill Rd
- 4019 Fir Forest Dr
- 17618 Tall Cypress Dr
- 17623 Bent Cypress Dr
- 5202 Summerfield Ln
- 5206 Summerfield Ln
- 17903 Fireside Dr
- 4416 W Cypress Villas Dr
- 4420 W Cypress Villas Dr
- 4422 W Cypress Villas Dr
- 4418 W Cypress Villas Dr
- 4410 W Cypress Villas Dr
- 4424 W Cypress Villas Dr
- 4436 W Cypress Villas Dr
- 4434 W Cypress Villas Dr
- 4438 W Cypress Villas Dr
- 4432 W Cypress Villas Dr
- 4442 W Cypress Villas Dr
- 4444 W Cypress Villas Dr
- 4440 W Cypress Villas Dr
- 4425 W Cypress Villas Dr
- 4446 W Cypress Villas Dr
- 4405 W Cypress Villas Dr
- 4429 W Cypress Villas Dr
- 4447 W Cypress Villas Dr
- 4458 W Cypress Villas Dr
- 4456 W Cypress Villas Dr