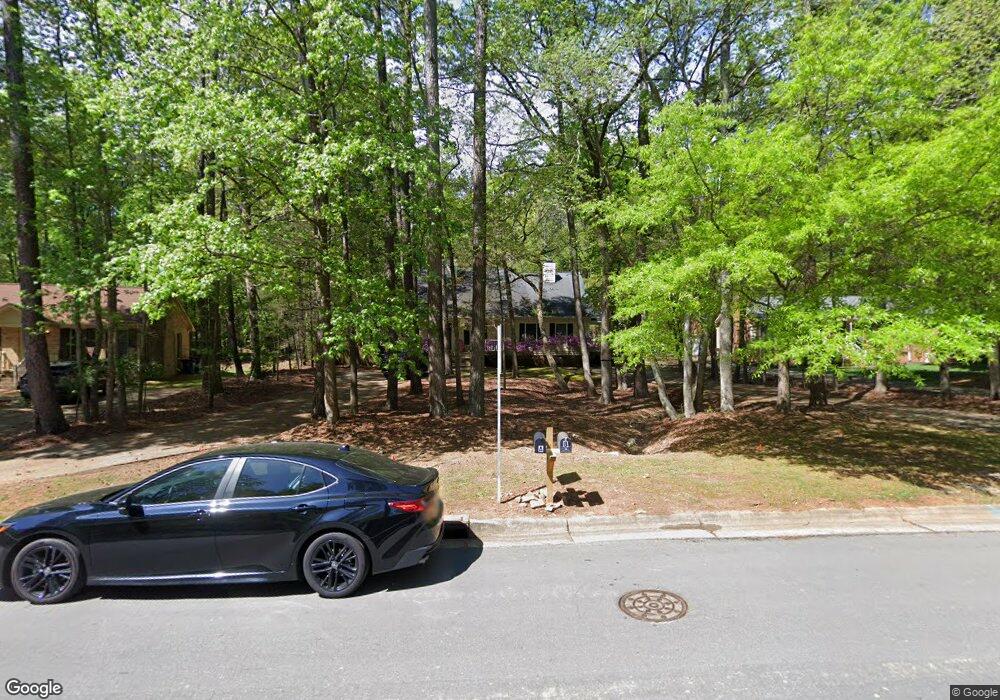
4415 American Dr Unit B Durham, NC 27705
West Durham NeighborhoodEstimated Value: $488,000 - $539,000
2
Beds
2
Baths
2,291
Sq Ft
$224/Sq Ft
Est. Value
About This Home
This home is located at 4415 American Dr Unit B, Durham, NC 27705 and is currently estimated at $512,603, approximately $223 per square foot. 4415 American Dr Unit B is a home located in Durham County with nearby schools including Morehead Montessori, Brogden Middle, and Riverside High School.
Ownership History
Date
Name
Owned For
Owner Type
Purchase Details
Closed on
Feb 7, 2020
Sold by
Harris Larry J and Harris Laura M
Bought by
Harris Joseph Millard
Current Estimated Value
Home Financials for this Owner
Home Financials are based on the most recent Mortgage that was taken out on this home.
Original Mortgage
$214,800
Outstanding Balance
$198,827
Interest Rate
6.37%
Mortgage Type
New Conventional
Estimated Equity
$313,776
Purchase Details
Closed on
Oct 4, 2011
Sold by
Ljh Properties Llc
Bought by
Harris Larry
Purchase Details
Closed on
Jun 29, 2004
Sold by
Liggett Investments Llc
Bought by
Ljh Properties Llc
Home Financials for this Owner
Home Financials are based on the most recent Mortgage that was taken out on this home.
Original Mortgage
$170,865
Interest Rate
6.25%
Mortgage Type
Purchase Money Mortgage
Create a Home Valuation Report for This Property
The Home Valuation Report is an in-depth analysis detailing your home's value as well as a comparison with similar homes in the area
Home Values in the Area
Average Home Value in this Area
Purchase History
| Date | Buyer | Sale Price | Title Company |
|---|---|---|---|
| Harris Joseph Millard | $268,500 | None Available | |
| Harris Larry | -- | None Available | |
| Ljh Properties Llc | $205,000 | -- |
Source: Public Records
Mortgage History
| Date | Status | Borrower | Loan Amount |
|---|---|---|---|
| Open | Harris Joseph Millard | $214,800 | |
| Previous Owner | Ljh Properties Llc | $170,865 |
Source: Public Records
Tax History Compared to Growth
Tax History
| Year | Tax Paid | Tax Assessment Tax Assessment Total Assessment is a certain percentage of the fair market value that is determined by local assessors to be the total taxable value of land and additions on the property. | Land | Improvement |
|---|---|---|---|---|
| 2025 | $5,686 | $573,560 | $168,300 | $405,260 |
| 2024 | $4,032 | $289,017 | $74,160 | $214,857 |
| 2023 | $3,786 | $289,017 | $74,160 | $214,857 |
| 2022 | $3,699 | $289,017 | $74,160 | $214,857 |
| 2021 | $3,682 | $289,017 | $74,160 | $214,857 |
| 2020 | $3,595 | $289,017 | $74,160 | $214,857 |
| 2019 | $3,595 | $289,017 | $74,160 | $214,857 |
| 2018 | $3,190 | $235,138 | $65,920 | $169,218 |
| 2017 | $3,166 | $235,138 | $65,920 | $169,218 |
| 2016 | $3,059 | $235,138 | $65,920 | $169,218 |
| 2015 | $2,243 | $162,014 | $48,808 | $113,206 |
| 2014 | $2,243 | $162,014 | $48,808 | $113,206 |
Source: Public Records
Map
Nearby Homes
- 4316 American Dr
- 9 Carson Cir Unit A&B
- 24 Sunrise Place
- 310 Mckinley St
- 4704 Cumberland Dr
- 4002 Westfield Dr
- 108 Panamint Dr
- 123 Forest Oaks Dr
- 74 Forest Oaks Dr
- 82 Forest Oaks Dr
- 1013 Coldspring Cir
- 28 Prestwick Place
- 37 Georgetown Ct
- 210 Silas St
- Townhome B Exterior Plan at Croasdaile Farm - Bronze Leaf Townhomes
- Custom Plan at Croasdaile Farm - Bronze Leaf Townhomes
- Townhome B Interior Plan at Croasdaile Farm - Bronze Leaf Townhomes
- Townhome A Exterior Plan at Croasdaile Farm - Bronze Leaf Townhomes
- Townhome A Interior Plan at Croasdaile Farm - Bronze Leaf Townhomes
- 4022 W Cornwallis Rd
- 4415 American Dr
- 4419 American Dr
- 6 Brandywine Ct
- 4423 American Dr
- 4423 American Dr Unit A
- 4405 Brandywine Ct
- 4416 American Dr
- 8 Brandywine Ct
- 8 Brandywine Ct Unit B
- 4408 American Dr
- 4408 American Dr Unit B
- 4408 American Dr Unit B
- 4420 American Dr
- 4427 American Dr
- 9 Tarawa Terrace
- 9 Tarawa Terrace Unit B
- 9 Tarawa Terrace Unit A
- 4402 American Dr
- 4424 American Dr
- 4424 American Dr Unit A