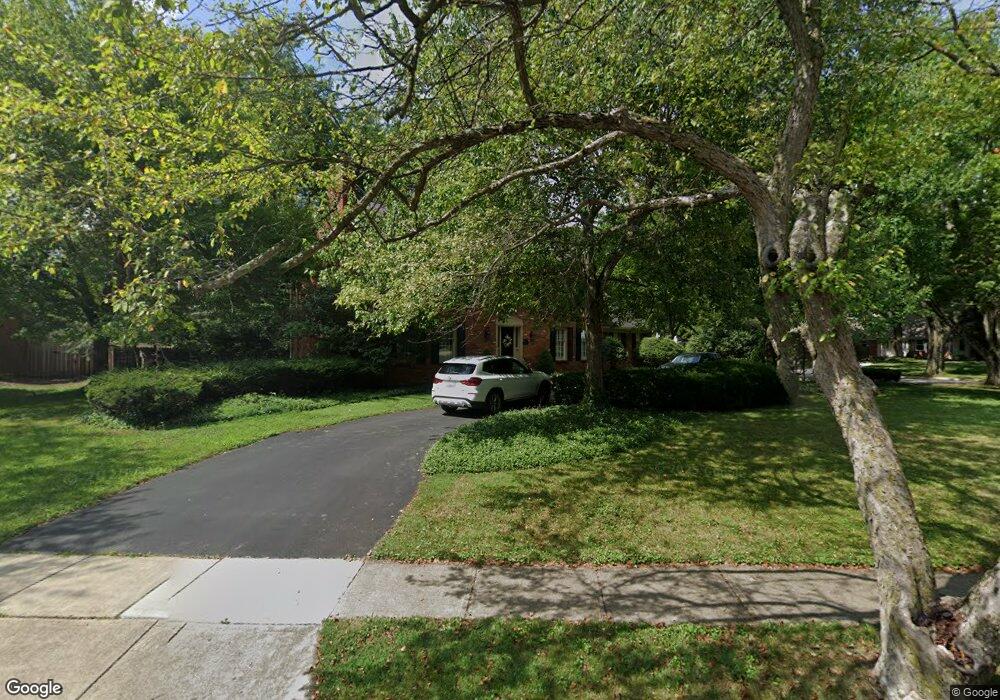
4415 Langport Rd Columbus, OH 43220
Estimated Value: $889,000 - $1,208,000
4
Beds
6
Baths
2,996
Sq Ft
$341/Sq Ft
Est. Value
About This Home
This home is located at 4415 Langport Rd, Columbus, OH 43220 and is currently estimated at $1,020,259, approximately $340 per square foot. 4415 Langport Rd is a home located in Franklin County with nearby schools including Windermere Elementary School, Hastings Middle School, and Upper Arlington High School.
Ownership History
Date
Name
Owned For
Owner Type
Purchase Details
Closed on
Sep 23, 2018
Sold by
Dee Matthew J and Dee Allison S
Bought by
Dee Matthew J and Dee Allison S
Current Estimated Value
Purchase Details
Closed on
Oct 7, 2003
Sold by
Ritter Mary D and Ritter Larry R
Bought by
Dee Matthew J and Dee Allison S
Home Financials for this Owner
Home Financials are based on the most recent Mortgage that was taken out on this home.
Original Mortgage
$472,000
Interest Rate
6.4%
Mortgage Type
Purchase Money Mortgage
Purchase Details
Closed on
Dec 3, 1990
Bought by
Ritter Mary D
Create a Home Valuation Report for This Property
The Home Valuation Report is an in-depth analysis detailing your home's value as well as a comparison with similar homes in the area
Home Values in the Area
Average Home Value in this Area
Purchase History
| Date | Buyer | Sale Price | Title Company |
|---|---|---|---|
| Dee Matthew J | -- | None Available | |
| Dee Matthew J | -- | None Available | |
| Dee Matthew J | $590,000 | Connor Land Title | |
| Ritter Mary D | -- | -- |
Source: Public Records
Mortgage History
| Date | Status | Borrower | Loan Amount |
|---|---|---|---|
| Closed | Dee Matthew J | $472,000 |
Source: Public Records
Tax History Compared to Growth
Tax History
| Year | Tax Paid | Tax Assessment Tax Assessment Total Assessment is a certain percentage of the fair market value that is determined by local assessors to be the total taxable value of land and additions on the property. | Land | Improvement |
|---|---|---|---|---|
| 2024 | $18,918 | $326,770 | $88,800 | $237,970 |
| 2023 | $18,683 | $326,770 | $88,800 | $237,970 |
| 2022 | $20,527 | $293,760 | $74,970 | $218,790 |
| 2021 | $18,171 | $293,760 | $74,970 | $218,790 |
| 2020 | $18,010 | $293,760 | $74,970 | $218,790 |
| 2019 | $16,509 | $238,070 | $74,970 | $163,100 |
| 2018 | $15,577 | $238,070 | $74,970 | $163,100 |
| 2017 | $16,382 | $238,070 | $74,970 | $163,100 |
| 2016 | $14,751 | $223,100 | $63,180 | $159,920 |
| 2015 | $14,738 | $223,100 | $63,180 | $159,920 |
| 2014 | $14,755 | $223,100 | $63,180 | $159,920 |
| 2013 | $7,286 | $209,720 | $57,435 | $152,285 |
Source: Public Records
Map
Nearby Homes
- 4540 Langport Rd
- 4371 Latin Ln Unit 122
- 2681 Lane Rd
- 4270 Llanfair Ct
- 3055 Carriage Ln
- 4450 Haverford Ct
- 3950 Riverside Dr
- 4390 Dublin Rd
- 4115 Woodbridge Rd
- 4025 Dublin Rd
- 4400 Dublin Rd
- 3320 Scioto Run Blvd
- 2231 Atlee Ct Unit 12
- 4765 Coach Rd
- 3959 Woodbridge Rd
- 3830 Riverview Dr
- 2198 Sandston Rd
- 2300 Hoxton Ct
- 2165 Partlow Dr
- 5000 Slate Run Woods Ct
- 2730 Alliston Ct
- 2731 Elginfield Rd
- 0 Alliston Ct
- 2721 Alliston Ct
- 4410 Langport Rd
- 2743 Elginfield Rd
- 4385 Langport Rd
- 2750 Alliston Ct
- 2731 Alliston Ct
- 4434 Langport Rd
- 2757 Elginfield Rd
- 2751 Alliston Ct
- 2720 Lymington Rd
- 2691 Alliston Ct
- 2770 Alliston Ct
- 2676 Alliston Ct
- 2706 Lymington Rd
- 4444 Langport Rd
- 2734 Lymington Rd
- 4455 Langport Rd