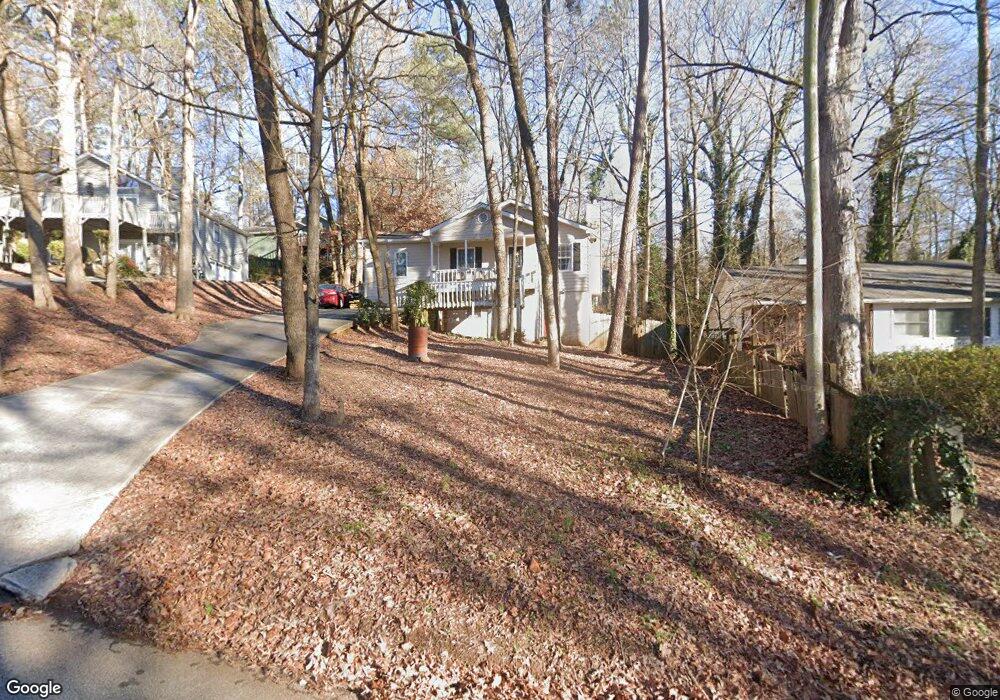
4416 Cary Dr Unit 346 Snellville, GA 30039
Estimated Value: $248,000 - $301,000
3
Beds
4
Baths
1,118
Sq Ft
$249/Sq Ft
Est. Value
About This Home
This home is located at 4416 Cary Dr Unit 346, Snellville, GA 30039 and is currently estimated at $278,118, approximately $248 per square foot. 4416 Cary Dr Unit 346 is a home located in Gwinnett County with nearby schools including Anderson-Livsey Elementary School, Shiloh Middle School, and Shiloh High School.
Ownership History
Date
Name
Owned For
Owner Type
Purchase Details
Closed on
Jan 31, 2019
Sold by
Srp Sub Llc
Bought by
Mandujano Rosa I Coronado
Current Estimated Value
Purchase Details
Closed on
May 9, 2017
Sold by
Not Provided
Bought by
Srp Sub Llc
Purchase Details
Closed on
Apr 4, 2014
Sold by
Rbp Llc
Bought by
Beauly Llc
Purchase Details
Closed on
Apr 3, 2014
Sold by
National Housing Counselin
Bought by
Rbp Llc
Purchase Details
Closed on
May 20, 2011
Sold by
Deutsche Bk Trust 2006-1
Bought by
National Hsng Counseling Agcy
Purchase Details
Closed on
Nov 2, 2010
Sold by
Jarrell Sherry L
Bought by
Fremont Home Loan Trust 2006-1
Purchase Details
Closed on
May 4, 1999
Sold by
Kennedy Sandra
Bought by
Davis Lorayne J
Home Financials for this Owner
Home Financials are based on the most recent Mortgage that was taken out on this home.
Original Mortgage
$91,900
Interest Rate
7%
Mortgage Type
FHA
Create a Home Valuation Report for This Property
The Home Valuation Report is an in-depth analysis detailing your home's value as well as a comparison with similar homes in the area
Home Values in the Area
Average Home Value in this Area
Purchase History
| Date | Buyer | Sale Price | Title Company |
|---|---|---|---|
| Mandujano Rosa I Coronado | $132,000 | -- | |
| Srp Sub Llc | -- | -- | |
| Beauly Llc | $60,000 | -- | |
| Rbp Llc | $53,000 | -- | |
| National Hsng Counseling Agcy | -- | -- | |
| Fremont Home Loan Trust 2006-1 | $30,600 | -- | |
| Davis Lorayne J | $92,000 | -- |
Source: Public Records
Mortgage History
| Date | Status | Borrower | Loan Amount |
|---|---|---|---|
| Previous Owner | Davis Lorayne J | $91,900 |
Source: Public Records
Tax History Compared to Growth
Tax History
| Year | Tax Paid | Tax Assessment Tax Assessment Total Assessment is a certain percentage of the fair market value that is determined by local assessors to be the total taxable value of land and additions on the property. | Land | Improvement |
|---|---|---|---|---|
| 2024 | $4,388 | $114,280 | $20,000 | $94,280 |
| 2023 | $4,388 | $115,080 | $20,000 | $95,080 |
| 2022 | $3,849 | $100,120 | $14,000 | $86,120 |
| 2021 | $2,670 | $65,920 | $10,000 | $55,920 |
| 2020 | $2,683 | $65,920 | $10,000 | $55,920 |
| 2019 | $2,302 | $57,680 | $10,000 | $47,680 |
| 2018 | $2,299 | $57,680 | $10,000 | $47,680 |
| 2016 | $1,865 | $44,760 | $8,000 | $36,760 |
| 2015 | $1,150 | $24,000 | $4,800 | $19,200 |
| 2014 | -- | $24,000 | $4,800 | $19,200 |
Source: Public Records
Map
Nearby Homes