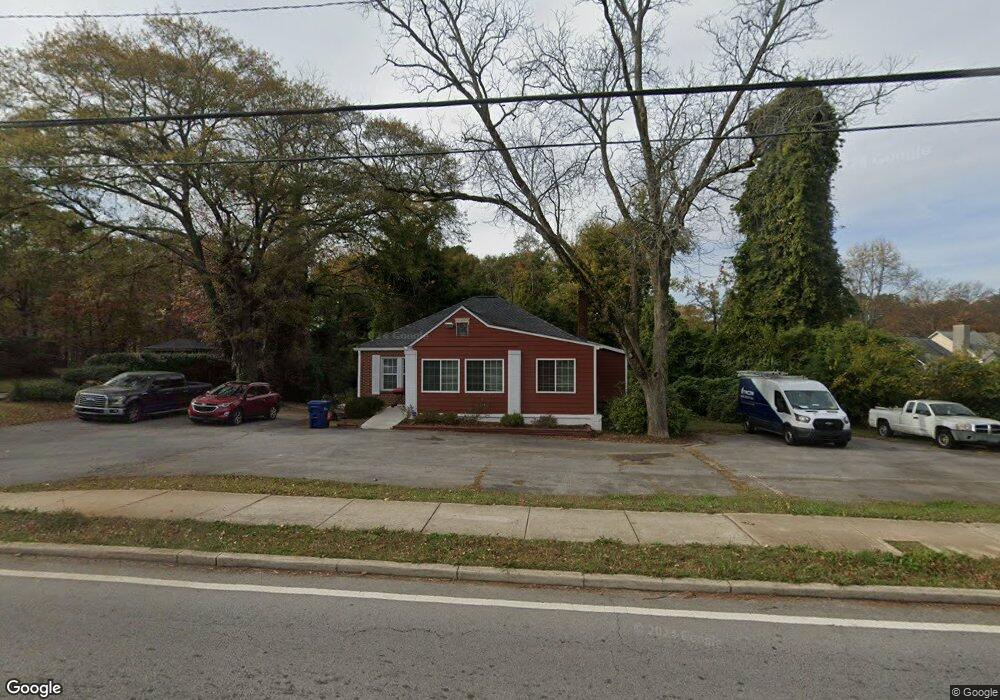
4416 E Ponce de Leon Ave Clarkston, GA 30021
Estimated Value: $316,000 - $362,000
3
Beds
1
Bath
1,704
Sq Ft
$204/Sq Ft
Est. Value
About This Home
This home is located at 4416 E Ponce de Leon Ave, Clarkston, GA 30021 and is currently estimated at $347,291, approximately $203 per square foot. 4416 E Ponce de Leon Ave is a home located in DeKalb County with nearby schools including Idlewood Elementary School, Tucker Middle School, and Tucker High School.
Ownership History
Date
Name
Owned For
Owner Type
Purchase Details
Closed on
Aug 1, 2011
Sold by
Nelkin Mark
Bought by
Nelkin Rental Houses Llc
Current Estimated Value
Home Financials for this Owner
Home Financials are based on the most recent Mortgage that was taken out on this home.
Original Mortgage
$806,000
Outstanding Balance
$555,027
Interest Rate
4.53%
Mortgage Type
New Conventional
Estimated Equity
-$207,736
Purchase Details
Closed on
Apr 18, 2003
Sold by
United Nations Realty Inc
Bought by
Nelkin Mark
Purchase Details
Closed on
Nov 30, 1998
Sold by
Greenway Virginia O-Etal
Bought by
Tritt Whitney
Purchase Details
Closed on
Oct 10, 1997
Sold by
Greenway Virginia O and Greenway J W
Bought by
Willis Cedrick
Home Financials for this Owner
Home Financials are based on the most recent Mortgage that was taken out on this home.
Original Mortgage
$70,000
Interest Rate
7.55%
Create a Home Valuation Report for This Property
The Home Valuation Report is an in-depth analysis detailing your home's value as well as a comparison with similar homes in the area
Home Values in the Area
Average Home Value in this Area
Purchase History
| Date | Buyer | Sale Price | Title Company |
|---|---|---|---|
| Nelkin Rental Houses Llc | -- | -- | |
| Nelkin Mark | $117,000 | -- | |
| Tritt Whitney | $60,000 | -- | |
| Willis Cedrick | $72,000 | -- |
Source: Public Records
Mortgage History
| Date | Status | Borrower | Loan Amount |
|---|---|---|---|
| Open | Nelkin Rental Houses Llc | $806,000 | |
| Previous Owner | Willis Cedrick | $70,000 | |
| Closed | Tritt Whitney | -- |
Source: Public Records
Tax History Compared to Growth
Tax History
| Year | Tax Paid | Tax Assessment Tax Assessment Total Assessment is a certain percentage of the fair market value that is determined by local assessors to be the total taxable value of land and additions on the property. | Land | Improvement |
|---|---|---|---|---|
| 2025 | $7,881 | $141,400 | $35,840 | $105,560 |
| 2024 | $6,003 | $117,120 | $35,840 | $81,280 |
| 2023 | $6,003 | $126,120 | $35,840 | $90,280 |
| 2022 | $5,268 | $100,560 | $29,120 | $71,440 |
| 2021 | $4,575 | $87,320 | $29,120 | $58,200 |
| 2020 | $2,656 | $48,680 | $16,040 | $32,640 |
| 2019 | $3,066 | $56,360 | $16,040 | $40,320 |
| 2018 | $2,733 | $52,760 | $13,160 | $39,600 |
| 2017 | $1,347 | $23,040 | $13,160 | $9,880 |
| 2016 | $1,870 | $33,600 | $13,160 | $20,440 |
| 2014 | $1,168 | $18,880 | $13,160 | $5,720 |
Source: Public Records
Map
Nearby Homes
- 1297 Tree Creek Ct
- 3647 Cobble Mill Ln Unit Ste B4
- 1362 Brockett Place Unit 1362
- 1310 Brockett Place
- 3816 Prescott Ridge Cir Unit 30
- 1166 Vaughan St
- 1172 Denison Dr
- 3722 S Marlborough Dr
- 115 Plantation Dr
- 957 Texel Ln Unit 4
- 907 E Green Ln
- 3965 Camelot Ct
- 1372 Idlewood Parc Crossing
- 4201 Church St
- 3636 Castle Rock Way
- 4549 Erskine Rd
- 1608 Cooledge Rd
- 3755 Windsor Cir
- 3757 Windsor Cir
- 3756 Windsor Cir
- 3759 Windsor Cir
- 3758 Windsor Cir
- 3760 Windsor Cir
- 3760 Windsor Cir Unit 3760
- 3761 Windsor Cir
- 3762 Windsor Cir
- 3763 Windsor Cir
- 3744 Windsor Cir
- 3764 Windsor Cir
- 3742 Windsor Cir
- 3766 Windsor Cir
- 3765 Windsor Cir Unit N/a
- 3740 Windsor Cir
- 3738 Windsor Cir
- 4392 E Ponce de Leon Ave
- 3736 Windsor Cir
- 3734 Windsor Cir