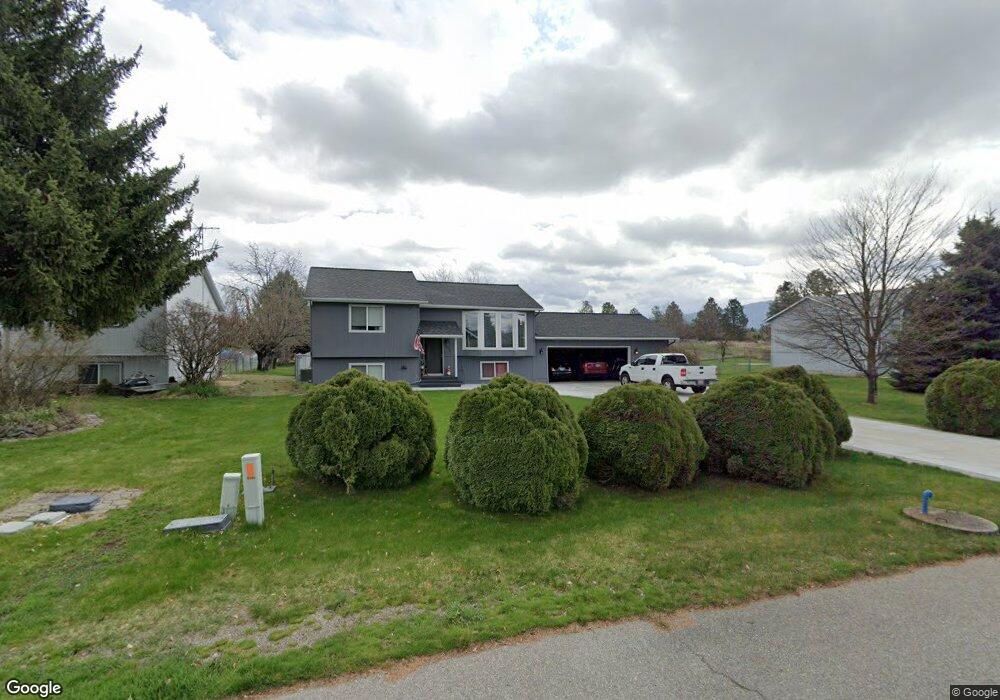
4416 N Molter Rd Otis Orchards, WA 99027
Otis Orchards-East Farms NeighborhoodEstimated Value: $402,000 - $504,000
4
Beds
2
Baths
1,540
Sq Ft
$308/Sq Ft
Est. Value
About This Home
This home is located at 4416 N Molter Rd, Otis Orchards, WA 99027 and is currently estimated at $474,723, approximately $308 per square foot. 4416 N Molter Rd is a home located in Spokane County with nearby schools including Otis Orchards School, East Valley Middle School, and East Valley High School & Extension.
Ownership History
Date
Name
Owned For
Owner Type
Purchase Details
Closed on
Oct 16, 2013
Sold by
Browning John and Browning Laura
Bought by
Dunken Ivan and The Estate Of Wanda L Dunken
Current Estimated Value
Purchase Details
Closed on
Oct 26, 1998
Sold by
Browning Laura M and Meulman Laura M
Bought by
Browning John S and Browning Laura M
Home Financials for this Owner
Home Financials are based on the most recent Mortgage that was taken out on this home.
Original Mortgage
$88,031
Interest Rate
6.6%
Mortgage Type
FHA
Purchase Details
Closed on
Mar 26, 1996
Sold by
Boyd Scott G and Boyd Shannon M
Bought by
Meulman Laura M
Home Financials for this Owner
Home Financials are based on the most recent Mortgage that was taken out on this home.
Original Mortgage
$86,652
Interest Rate
6.98%
Mortgage Type
FHA
Create a Home Valuation Report for This Property
The Home Valuation Report is an in-depth analysis detailing your home's value as well as a comparison with similar homes in the area
Home Values in the Area
Average Home Value in this Area
Purchase History
| Date | Buyer | Sale Price | Title Company |
|---|---|---|---|
| Dunken Ivan | -- | None Available | |
| Browning John S | -- | Pacific Northwest Title | |
| Meulman Laura M | $87,000 | Transnation Title |
Source: Public Records
Mortgage History
| Date | Status | Borrower | Loan Amount |
|---|---|---|---|
| Previous Owner | Browning John S | $88,031 | |
| Previous Owner | Meulman Laura M | $86,652 |
Source: Public Records
Tax History Compared to Growth
Tax History
| Year | Tax Paid | Tax Assessment Tax Assessment Total Assessment is a certain percentage of the fair market value that is determined by local assessors to be the total taxable value of land and additions on the property. | Land | Improvement |
|---|---|---|---|---|
| 2025 | $3,811 | $393,400 | $126,300 | $267,100 |
| 2024 | $3,811 | $386,190 | $121,290 | $264,900 |
| 2023 | $3,774 | $386,190 | $121,290 | $264,900 |
| 2022 | $3,480 | $384,390 | $121,290 | $263,100 |
| 2021 | $3,393 | $266,870 | $85,870 | $181,000 |
| 2020 | $3,298 | $245,800 | $80,800 | $165,000 |
| 2019 | $2,748 | $206,800 | $75,600 | $131,200 |
| 2018 | $2,752 | $193,030 | $60,430 | $132,600 |
| 2017 | $2,571 | $180,730 | $60,430 | $120,300 |
| 2016 | $2,299 | $162,520 | $50,420 | $112,100 |
| 2015 | $2,339 | $159,820 | $50,420 | $109,400 |
| 2014 | -- | $159,820 | $50,420 | $109,400 |
| 2013 | -- | $0 | $0 | $0 |
Source: Public Records
Map
Nearby Homes
- 4806 N Drury Rd
- 24005 E Garland Ave
- 23007 E Sanson Ln
- 5605 N Drury Rd
- 22707 E Rowan Ave
- 23010 E Edgewater Ln
- 23015 E Edgewater Ln
- 23013 E Edgewater Ln
- 21725 E Wellesley Ave Unit 9
- 21725 E Wellesley Ave Unit 24
- 6205 N Ormond Rd
- 24672 Hawkstone Loop
- 99999 E Dalke Ave
- 21725 E Wellesley #38 Ave Unit 38
- 2625 N Rydal Ln
- 22891 Tory Ct
- 22841 E Tory Ct
- 24443 E Pinnacle Ct Unit 24443
- 22512 Penrose Ln
- 2675 N Rydal Ln
- 4420 N Molter Rd
- 4410 N Molter Rd
- 4406 N Molter Rd
- 4423 N Molter Rd
- 4415 N Molter Rd
- 4407 N Molter Rd
- 4316 N Molter Rd
- 4321 N Molter Rd
- 23612 E Railroad Ave
- 4313 N Molter Rd
- 23620 E Railroad Ave
- 4308 N Molter Rd
- 4305 N Molter Rd
- 23712 E Railroad Ave
- 4219 N Molter Rd
- 23606 E Wellesley Ave
- 4216 N Molter Rd
- 4211 N Molter Rd
- 4604 N Ormond Rd
- 23408 E Wellesley Ave