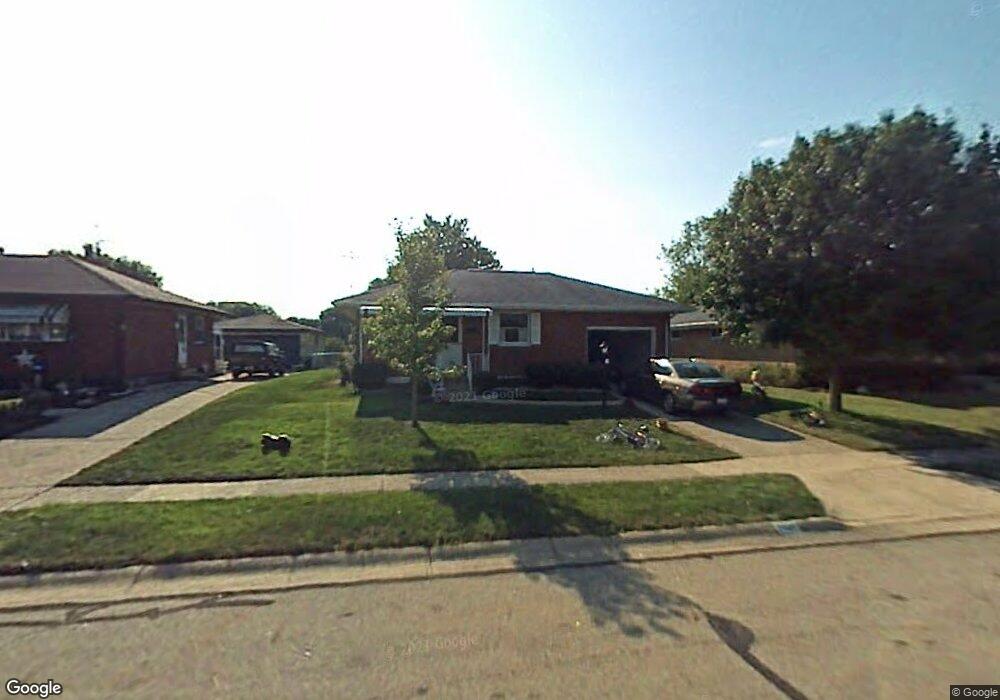
4417 Burchill St Springfield, OH 45503
Estimated Value: $186,442 - $240,000
3
Beds
2
Baths
1,075
Sq Ft
$190/Sq Ft
Est. Value
About This Home
This home is located at 4417 Burchill St, Springfield, OH 45503 and is currently estimated at $203,861, approximately $189 per square foot. 4417 Burchill St is a home located in Clark County with nearby schools including Northridge Elementary School, Kenton Ridge Middle & High School, and Emmanuel Christian Academy.
Ownership History
Date
Name
Owned For
Owner Type
Purchase Details
Closed on
Apr 6, 2016
Sold by
Kyle Traci
Bought by
Kyle Traci and Kyle Linda L
Current Estimated Value
Purchase Details
Closed on
May 1, 2015
Sold by
Perry William A
Bought by
Kyle Traci
Purchase Details
Closed on
Feb 22, 2011
Sold by
Self Help Ventures Fund
Bought by
Perry William A
Purchase Details
Closed on
Oct 15, 2010
Sold by
Federal National Mortgage Association
Bought by
Self Help Ventures Fund
Purchase Details
Closed on
Sep 8, 2010
Sold by
Cave Stephanie K
Bought by
Federal National Mortgage Association
Purchase Details
Closed on
Mar 9, 2007
Sold by
Cooper Andrew
Bought by
Cave Stephanie
Home Financials for this Owner
Home Financials are based on the most recent Mortgage that was taken out on this home.
Original Mortgage
$109,900
Interest Rate
6.4%
Mortgage Type
Purchase Money Mortgage
Create a Home Valuation Report for This Property
The Home Valuation Report is an in-depth analysis detailing your home's value as well as a comparison with similar homes in the area
Home Values in the Area
Average Home Value in this Area
Purchase History
| Date | Buyer | Sale Price | Title Company |
|---|---|---|---|
| Kyle Traci | -- | Team Title & Closing Service | |
| Kyle Traci | $94,000 | Ohio Real Estate Title | |
| Perry William A | $48,000 | Service Link | |
| Self Help Ventures Fund | $93,500 | Service Link | |
| Federal National Mortgage Association | $53,400 | None Available | |
| Cave Stephanie | $109,900 | Ohio Real Estate Title |
Source: Public Records
Mortgage History
| Date | Status | Borrower | Loan Amount |
|---|---|---|---|
| Previous Owner | Cave Stephanie | $109,900 |
Source: Public Records
Tax History
| Year | Tax Paid | Tax Assessment Tax Assessment Total Assessment is a certain percentage of the fair market value that is determined by local assessors to be the total taxable value of land and additions on the property. | Land | Improvement |
|---|---|---|---|---|
| 2025 | $1,262 | $60,710 | $16,790 | $43,920 |
| 2024 | $1,247 | $38,670 | $9,780 | $28,890 |
| 2023 | $1,247 | $38,670 | $9,780 | $28,890 |
| 2022 | $1,270 | $38,670 | $9,780 | $28,890 |
| 2021 | $1,314 | $34,980 | $7,240 | $27,740 |
| 2020 | $1,315 | $34,980 | $7,240 | $27,740 |
| 2019 | $1,340 | $34,980 | $7,240 | $27,740 |
| 2018 | $1,466 | $36,170 | $9,230 | $26,940 |
| 2017 | $1,257 | $31,066 | $9,226 | $21,840 |
| 2016 | $1,645 | $31,066 | $9,226 | $21,840 |
| 2015 | $1,602 | $30,713 | $8,873 | $21,840 |
| 2014 | $801 | $30,713 | $8,873 | $21,840 |
| 2013 | $1,565 | $30,713 | $8,873 | $21,840 |
Source: Public Records
Map
Nearby Homes
- 4343 Burchill St
- 4741 Cullen Ave
- 1341 Student Ave
- 4802 Willowbrook Dr
- 4322 Midfield St Unit 15
- 4256 Midfield St Unit 9
- 4446 Ridgewood Rd E Unit 3
- 593 Hiser Ave
- 4577 Reno Ln Unit 2
- 4652 Reno Ln Unit 15
- 1162 Kingsgate Rd
- 3942 Harris Ln
- 1201 Kingsgate Rd
- 5033 Ridgewood Rd E
- 5300 Brookshire Ln
- 1521 Erika Dr
- 1500 Kingsgate Rd Unit 19430
- 1502 Kingsgate Rd Unit 19432
- 1500 Kingsgate Rd
- 1509 Kingsgate Rd
- 4411 Burchill St
- 4423 Burchill St
- 4405 Burchill St
- 4431 Burchill St
- 4431 Randall Dr
- 4430 Burchill St
- 4355 Burchill St
- 4437 Burchill St
- 4406 Burchill St
- 4427 Randall Dr
- 4436 Burchill St
- 4349 Burchill St
- 4354 Burchill St
- 1063 Cheyenne Ave
- 4428 Randall Dr
- 1055 Cheyenne Ave
- 1053 Cheyenne Ave Unit 1053
- 1051 Cheyenne Ave
- 1047 Cheyenne Ave
- 1045 Cheyenne Ave Unit 1045
Your Personal Tour Guide
Ask me questions while you tour the home.