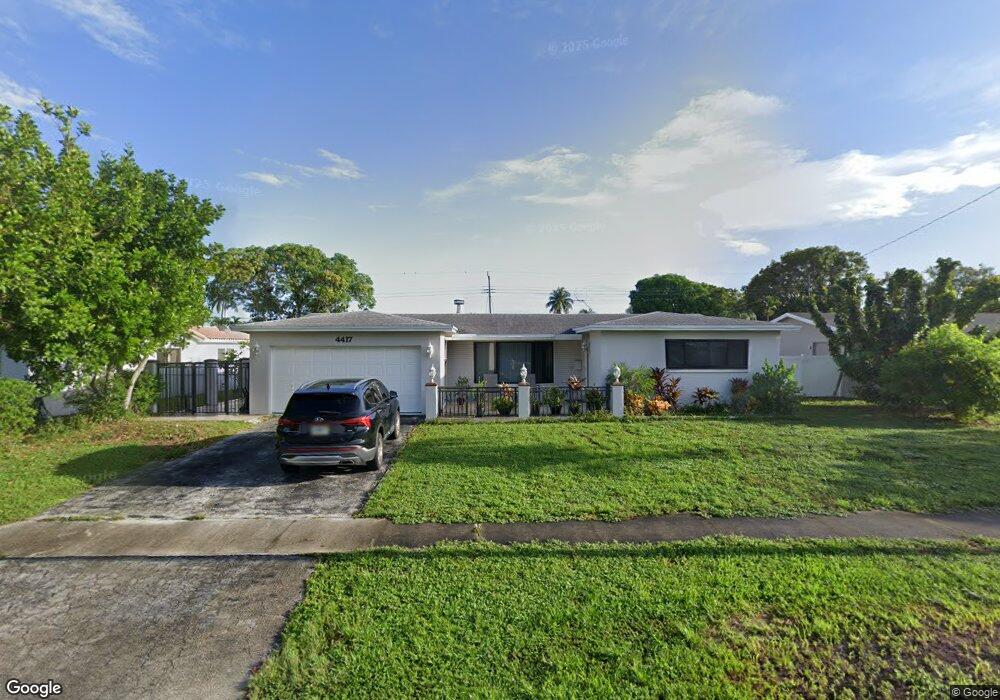
4417 Monroe St Hollywood, FL 33021
Hollywood Hills NeighborhoodEstimated Value: $715,525 - $805,000
5
Beds
3
Baths
1,815
Sq Ft
$423/Sq Ft
Est. Value
About This Home
This home is located at 4417 Monroe St, Hollywood, FL 33021 and is currently estimated at $768,381, approximately $423 per square foot. 4417 Monroe St is a home located in Broward County with nearby schools including Orange Brook Elementary School, Olsen Middle School, and South Broward High School.
Ownership History
Date
Name
Owned For
Owner Type
Purchase Details
Closed on
Mar 28, 2016
Sold by
Monan Inc
Bought by
Nussenblatt Steven
Current Estimated Value
Home Financials for this Owner
Home Financials are based on the most recent Mortgage that was taken out on this home.
Original Mortgage
$304,000
Outstanding Balance
$241,271
Interest Rate
3.65%
Mortgage Type
New Conventional
Estimated Equity
$527,110
Purchase Details
Closed on
Mar 3, 2015
Sold by
Velazco Julian and Velazco Elira
Bought by
Monan Inc
Purchase Details
Closed on
Jun 30, 2004
Sold by
Colao Alex and Colao Lorraine
Bought by
Velazco Patricia and Velazco Julian
Home Financials for this Owner
Home Financials are based on the most recent Mortgage that was taken out on this home.
Original Mortgage
$243,750
Interest Rate
6.25%
Mortgage Type
Stand Alone First
Purchase Details
Closed on
Jan 2, 1997
Sold by
Spencer William S and Spencer Joyce H
Bought by
Colao Alex and Colao Lorraine A
Create a Home Valuation Report for This Property
The Home Valuation Report is an in-depth analysis detailing your home's value as well as a comparison with similar homes in the area
Home Values in the Area
Average Home Value in this Area
Purchase History
| Date | Buyer | Sale Price | Title Company |
|---|---|---|---|
| Nussenblatt Steven | $380,000 | Attorney | |
| Monan Inc | $205,100 | None Available | |
| Velazco Patricia | $325,000 | Southern Financial Title Ser | |
| Colao Alex | $152,000 | -- |
Source: Public Records
Mortgage History
| Date | Status | Borrower | Loan Amount |
|---|---|---|---|
| Open | Nussenblatt Steven | $304,000 | |
| Previous Owner | Velazco Patricia | $243,750 | |
| Closed | Velazco Patricia | $45,500 |
Source: Public Records
Tax History Compared to Growth
Tax History
| Year | Tax Paid | Tax Assessment Tax Assessment Total Assessment is a certain percentage of the fair market value that is determined by local assessors to be the total taxable value of land and additions on the property. | Land | Improvement |
|---|---|---|---|---|
| 2025 | $11,363 | $447,380 | -- | -- |
| 2024 | $11,153 | $434,780 | -- | -- |
| 2023 | $11,153 | $422,120 | $0 | $0 |
| 2022 | $10,720 | $409,830 | $0 | $0 |
| 2021 | $10,520 | $397,900 | $0 | $0 |
| 2020 | $10,418 | $392,410 | $0 | $0 |
| 2019 | $10,332 | $383,590 | $60,780 | $322,810 |
| 2018 | $10,278 | $389,950 | $60,780 | $329,170 |
| 2017 | $10,550 | $361,000 | $0 | $0 |
| 2016 | $7,112 | $323,090 | $0 | $0 |
| 2015 | $3,814 | $206,920 | $0 | $0 |
| 2014 | $3,820 | $205,280 | $0 | $0 |
| 2013 | -- | $230,640 | $65,850 | $164,790 |
Source: Public Records
Map
Nearby Homes
- 4408 Monroe St
- 4515 Jackson St
- 600 S 46th Ave
- 4115 Madison St
- 4812 Van Buren St
- 4911 Jackson St
- 4801 Harrison St
- 4709 Washington St
- 4650 Washington St Unit 210
- 4650 Washington St Unit 504
- 4650 Washington St Unit 502
- 901 Hillcrest Dr Unit 215
- 1600 Tallwood Ave Unit 308
- 919 Hillcrest Dr Unit 306
- 4700 Washington St Unit 210
- 4307 Tyler St
- 4901 Washington St
- 3917 Adams St
- 950 Hillcrest Dr Unit 302
- 950 Hillcrest Dr Unit 414
- 4409 Monroe St
- 4501 Monroe St
- 4509 Monroe St
- 4416 Jackson St
- 4401 Monroe St
- 4424 Jackson St
- 4408 Jackson St
- 4500 Jackson St
- 4416 Monroe St
- 4500 Monroe St
- 4517 Monroe St
- 4400 Jackson St
- 4508 Jackson St
- 4508 Monroe St
- 4400 Monroe St
- 4519 Monroe St
- 4519 Monroe St
- 4519 Monroe St
- 4519 Monroe St
- 4516 Jackson St