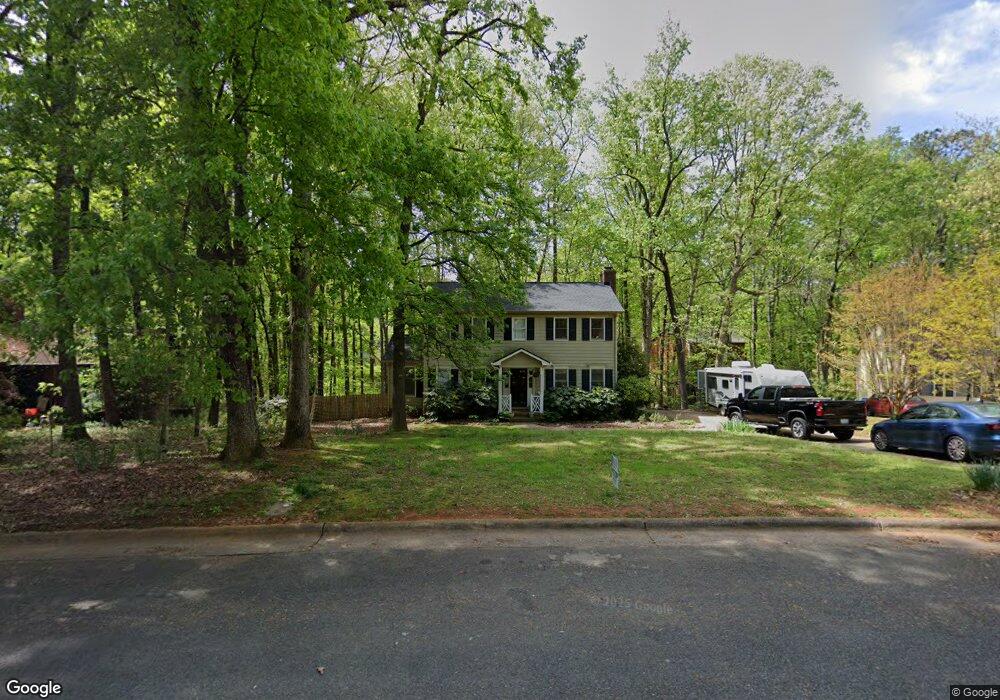
4417 Valley Forge Rd Durham, NC 27705
West Durham NeighborhoodEstimated Value: $466,000 - $571,000
3
Beds
3
Baths
1,844
Sq Ft
$274/Sq Ft
Est. Value
About This Home
This home is located at 4417 Valley Forge Rd, Durham, NC 27705 and is currently estimated at $504,606, approximately $273 per square foot. 4417 Valley Forge Rd is a home located in Durham County with nearby schools including Morehead Montessori, Forest View Elementary, and Brogden Middle.
Ownership History
Date
Name
Owned For
Owner Type
Purchase Details
Closed on
Nov 10, 2016
Sold by
Gilchrist John Edward
Bought by
Dunlap Mark and Dunlap Jennifer
Current Estimated Value
Home Financials for this Owner
Home Financials are based on the most recent Mortgage that was taken out on this home.
Original Mortgage
$202,400
Outstanding Balance
$162,748
Interest Rate
3.47%
Mortgage Type
New Conventional
Estimated Equity
$341,858
Purchase Details
Closed on
Oct 17, 1999
Sold by
Morrell Todd D and Morrell Elisabeth B
Bought by
Gilchrist John Edward and Gilchrist Carole Thompson
Home Financials for this Owner
Home Financials are based on the most recent Mortgage that was taken out on this home.
Original Mortgage
$110,000
Interest Rate
7.37%
Purchase Details
Closed on
Jun 23, 1999
Sold by
Zehnder Elisabeth B
Bought by
Morrell Elisabeth B Z and Zehnder Elisabeth B
Create a Home Valuation Report for This Property
The Home Valuation Report is an in-depth analysis detailing your home's value as well as a comparison with similar homes in the area
Home Values in the Area
Average Home Value in this Area
Purchase History
| Date | Buyer | Sale Price | Title Company |
|---|---|---|---|
| Dunlap Mark | $253,000 | -- | |
| Gilchrist John Edward | $150,000 | -- | |
| Morrell Elisabeth B Z | -- | -- |
Source: Public Records
Mortgage History
| Date | Status | Borrower | Loan Amount |
|---|---|---|---|
| Open | Dunlap Mark | $202,400 | |
| Previous Owner | Gilchrist John Edward | $110,000 |
Source: Public Records
Tax History
| Year | Tax Paid | Tax Assessment Tax Assessment Total Assessment is a certain percentage of the fair market value that is determined by local assessors to be the total taxable value of land and additions on the property. | Land | Improvement |
|---|---|---|---|---|
| 2025 | $4,821 | $486,341 | $137,700 | $348,641 |
| 2024 | $3,447 | $247,143 | $60,750 | $186,393 |
| 2023 | $3,237 | $247,143 | $60,750 | $186,393 |
| 2022 | $3,163 | $247,143 | $60,750 | $186,393 |
| 2021 | $3,148 | $247,143 | $60,750 | $186,393 |
| 2020 | $3,074 | $247,143 | $60,750 | $186,393 |
| 2019 | $3,074 | $247,143 | $60,750 | $186,393 |
| 2018 | $2,976 | $219,369 | $54,000 | $165,369 |
| 2017 | $2,890 | $214,620 | $54,000 | $160,620 |
| 2016 | $2,792 | $214,620 | $54,000 | $160,620 |
| 2015 | $2,621 | $189,311 | $33,436 | $155,875 |
| 2014 | $2,621 | $189,311 | $33,436 | $155,875 |
Source: Public Records
Map
Nearby Homes
- 4441 Talcott Dr
- 4310 American Dr
- 4231 American Dr Unit C
- 706 Constitution Dr Unit 405
- 708 Constitution Dr Unit F
- 710 Constitution Dr Unit 206
- 710 Constitution Dr Unit A
- 4111 Talcott Dr
- 4122 Westfield Dr
- 10 Sunrise Place
- 18 Pocono Dr
- 4704 Cumberland Dr
- 309 Lionel St
- 112 Salmon River Dr
- 410 Lionel St
- 412 Lionel St
- 74 Forest Oaks Dr
- 219 Silas St
- 4005 Tyndrum Dr
- 36 Georgetown Ct
- 4419 Valley Forge Rd
- 4415 Valley Forge Rd
- 15 Tarawa Terrace
- 14 Tarawa Terrace Unit B
- 14 Tarawa Terrace Unit A
- 14 Tarawa Terrace Unit B
- 4416 Valley Forge Rd
- 13 Tarawa Terrace
- 13 Tarawa Terrace Unit 2
- 13 Tarawa Terrace Unit A
- 13 Tarawa Terrace Unit A and B
- 13 Tarawa Terrace Unit B
- 4413 Valley Forge Rd
- 4423 Valley Forge Rd
- 4420 Valley Forge Rd
- 4412 Valley Forge Rd
- 4 Kinsey Ct
- 11 Tarawa Terrace Unit B
- 11 Tarawa Terrace
- 11 Tarawa Terrace Unit A & B
Your Personal Tour Guide
Ask me questions while you tour the home.