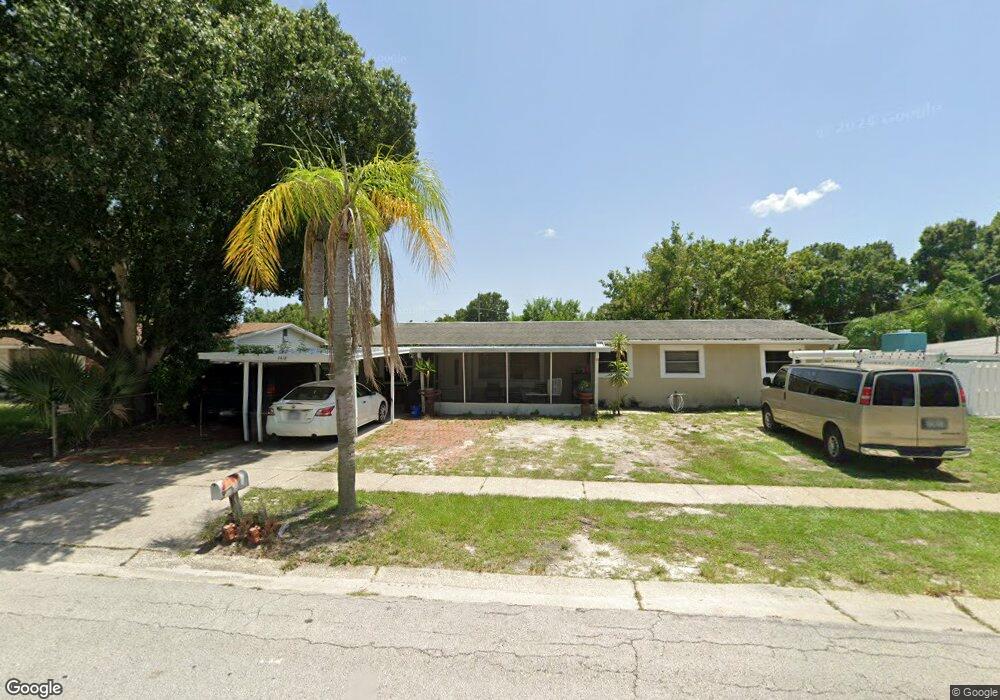
4418 W Fairview Heights Tampa, FL 33616
Sun Bay South NeighborhoodEstimated Value: $364,827 - $432,000
5
Beds
2
Baths
1,372
Sq Ft
$285/Sq Ft
Est. Value
About This Home
This home is located at 4418 W Fairview Heights, Tampa, FL 33616 and is currently estimated at $390,457, approximately $284 per square foot. 4418 W Fairview Heights is a home located in Hillsborough County with nearby schools including Lanier Elementary School, Monroe Middle School, and Robinson High School.
Ownership History
Date
Name
Owned For
Owner Type
Purchase Details
Closed on
Mar 8, 2018
Sold by
Bartley Niel L
Bought by
Gawfore Evelyn Alisa
Current Estimated Value
Purchase Details
Closed on
Feb 27, 2015
Sold by
Sandifer Sharon
Bought by
Bartley Investments Ltd
Purchase Details
Closed on
Jan 20, 2015
Sold by
Badger Investments Llc
Bought by
Sandifer Sharon
Purchase Details
Closed on
Jun 17, 2014
Sold by
Jaynes Stacy L
Bought by
Badger Investments Llc
Purchase Details
Closed on
Aug 23, 2013
Sold by
Jaynes Stacy L
Bought by
Jpmorgan Chase Bank Na
Purchase Details
Closed on
Nov 14, 2005
Sold by
Jaynes Jimmy E
Bought by
Jaynes Stacy L
Purchase Details
Closed on
Jul 15, 1994
Sold by
Roberts Lavonne L
Bought by
Jaynes Jimmy E and Jaynes Stacy L
Home Financials for this Owner
Home Financials are based on the most recent Mortgage that was taken out on this home.
Original Mortgage
$48,830
Interest Rate
8.52%
Create a Home Valuation Report for This Property
The Home Valuation Report is an in-depth analysis detailing your home's value as well as a comparison with similar homes in the area
Home Values in the Area
Average Home Value in this Area
Purchase History
| Date | Buyer | Sale Price | Title Company |
|---|---|---|---|
| Gawfore Evelyn Alisa | -- | None Available | |
| Bartley Investments Ltd | $152,500 | Stewart Title Company | |
| Sandifer Sharon | $149,500 | Stewart Title Company | |
| Badger Investments Llc | $90,000 | None Available | |
| Jpmorgan Chase Bank Na | -- | None Available | |
| Jaynes Stacy L | -- | -- | |
| Jaynes Jimmy E | $51,400 | -- |
Source: Public Records
Mortgage History
| Date | Status | Borrower | Loan Amount |
|---|---|---|---|
| Previous Owner | Jaynes Jimmy E | $48,830 |
Source: Public Records
Tax History Compared to Growth
Tax History
| Year | Tax Paid | Tax Assessment Tax Assessment Total Assessment is a certain percentage of the fair market value that is determined by local assessors to be the total taxable value of land and additions on the property. | Land | Improvement |
|---|---|---|---|---|
| 2024 | $5,175 | $259,776 | $113,088 | $146,688 |
| 2023 | $4,877 | $256,672 | $91,884 | $164,788 |
| 2022 | $4,632 | $259,940 | $84,816 | $175,124 |
| 2021 | $4,120 | $200,537 | $74,214 | $126,323 |
| 2020 | $3,739 | $174,584 | $77,748 | $96,836 |
| 2019 | $3,484 | $161,238 | $70,680 | $90,558 |
| 2018 | $3,258 | $157,364 | $0 | $0 |
| 2017 | $2,952 | $135,830 | $0 | $0 |
| 2016 | $2,649 | $119,375 | $0 | $0 |
| 2015 | $2,491 | $110,086 | $0 | $0 |
| 2014 | $2,125 | $114,047 | $0 | $0 |
| 2013 | -- | $67,853 | $0 | $0 |
Source: Public Records
Map
Nearby Homes
- 4715 W Montgomery Ave
- 4436 W Wisconsin Ave
- 4722 W Bay Ave
- 4420 W Wyoming Ave
- 4308 W Iowa Ave
- 4716 W Wisconsin Ave
- 4721 W Iowa Ave
- 4422 W Trilby Ave
- 6318 S Renellie Ct
- 4431 W Trilby Ave
- 4407 W Trilby Ave
- 4414 W Oklahoma Ave
- 4412 W Oklahoma Ave
- 4733 W Iowa Ave
- 4206 W Iowa Ave
- 5805 S Hubert Ave
- 4735 W Wisconsin Ave
- 4718 W Oklahoma Ave
- 4421 W Leila Ave
- 4114 W Olive St
- 4420 W Fairview Heights
- 4416 W Fairview Heights
- 4419 W Montgomery Ave
- 4421 W Montgomery Ave
- 4419 W Fairview Heights
- 4422 W Fairview Heights
- 4417 W Fairview Heights
- 4421 W Fairview Heights
- 4423 W Fairview Heights
- 4424 W Fairview Heights
- 4415 W Fairview Heights
- 4425 W Montgomery Ave
- 4418 W Bay Ave
- 4425 W Fairview Heights
- 4414 W Bay Ave
- 4422 W Bay Ave
- 4426 W Fairview Heights
- 4427 W Montgomery Ave
- 4427 W Montgomery Ave Unit A
- 4427 W Montgomery Ave Unit 1