4419 Bandy Rd Roanoke, VA 24014
Estimated Value: $560,000 - $630,000
3
Beds
3
Baths
2,994
Sq Ft
$199/Sq Ft
Est. Value
About This Home
This home is located at 4419 Bandy Rd, Roanoke, VA 24014 and is currently estimated at $595,913, approximately $199 per square foot. 4419 Bandy Rd is a home located in Roanoke County with nearby schools including Mt. Pleasant Elementary School, William Byrd Middle School, and William Byrd High School.
Ownership History
Date
Name
Owned For
Owner Type
Purchase Details
Closed on
Nov 12, 2019
Sold by
Kiker Joshua K and Kiker Tosha T
Bought by
Kiker Tosha T
Current Estimated Value
Home Financials for this Owner
Home Financials are based on the most recent Mortgage that was taken out on this home.
Original Mortgage
$320,000
Outstanding Balance
$281,518
Interest Rate
3.6%
Mortgage Type
New Conventional
Estimated Equity
$314,395
Purchase Details
Closed on
May 31, 2011
Sold by
Kiker Joshua K and Kiker Tosha T
Bought by
Dollberg David and Dollberg Michelle P
Purchase Details
Closed on
Apr 26, 2005
Sold by
Payne Ricky G and Payne Vicky S
Bought by
Kiker Joshua K and Kiker Tosha T
Home Financials for this Owner
Home Financials are based on the most recent Mortgage that was taken out on this home.
Original Mortgage
$313,000
Interest Rate
6%
Mortgage Type
VA
Create a Home Valuation Report for This Property
The Home Valuation Report is an in-depth analysis detailing your home's value as well as a comparison with similar homes in the area
Home Values in the Area
Average Home Value in this Area
Purchase History
| Date | Buyer | Sale Price | Title Company |
|---|---|---|---|
| Kiker Tosha T | -- | Performance Title & Setmnt | |
| Dollberg David | $1,600 | None Available | |
| Kiker Joshua K | $325,000 | None Available |
Source: Public Records
Mortgage History
| Date | Status | Borrower | Loan Amount |
|---|---|---|---|
| Open | Kiker Tosha T | $320,000 | |
| Previous Owner | Kiker Joshua K | $313,000 |
Source: Public Records
Tax History Compared to Growth
Tax History
| Year | Tax Paid | Tax Assessment Tax Assessment Total Assessment is a certain percentage of the fair market value that is determined by local assessors to be the total taxable value of land and additions on the property. | Land | Improvement |
|---|---|---|---|---|
| 2025 | $6,606 | $641,400 | $41,100 | $600,300 |
| 2024 | $5,956 | $572,700 | $41,100 | $531,600 |
| 2023 | $5,596 | $527,900 | $36,600 | $491,300 |
| 2022 | $4,924 | $451,700 | $36,600 | $415,100 |
| 2021 | $4,405 | $404,100 | $32,100 | $372,000 |
| 2020 | $4,270 | $391,700 | $32,100 | $359,600 |
| 2019 | $4,037 | $370,400 | $29,900 | $340,500 |
| 2018 | $3,747 | $362,700 | $29,900 | $332,800 |
| 2017 | $3,747 | $343,800 | $29,900 | $313,900 |
| 2016 | $3,745 | $343,600 | $29,900 | $313,700 |
| 2015 | $3,744 | $343,500 | $29,900 | $313,600 |
| 2014 | $3,743 | $343,400 | $29,900 | $313,500 |
Source: Public Records
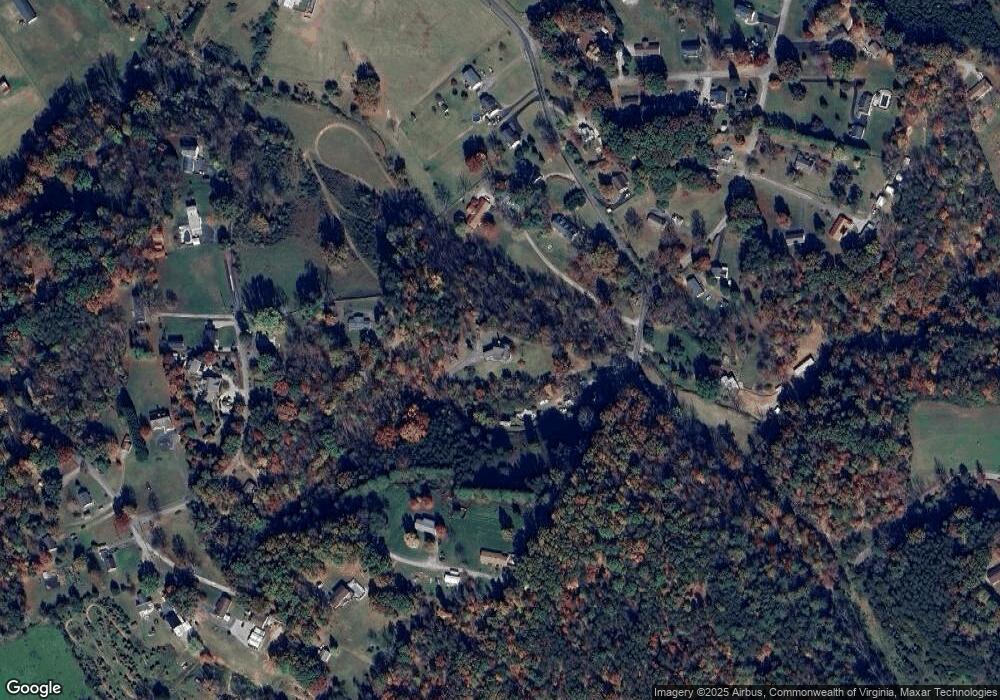
Map
Nearby Homes
- 0 Tall Pine Ln
- 4737 Yellow Mountain Rd
- 4515 Yellow Mountain Rd
- 4401 Yellow Mountain Rd
- 1631 Eanes Rd
- 3523 Bandy Rd
- 5122 Old Virginia Springs Rd
- 0 Mayland Rd
- 1701 Mayfield Dr
- 3709 Garden City Blvd SE
- 1147 Tipton Ave SE
- 1130 Ethel Rd SE
- 8995 Jubal Early Hwy
- 1313 Ashebrook Dr
- 3855 Saul Ln
- 0 Yellow Mountain Rd
- 5403 Clearbrook Ln
- 5507 Franklin Rd
- 3112 Garden City Blvd SE
- 3825 Saul Ln
- 4421 Bandy Rd
- 4369 Bandy Rd
- 4349 Bandy Rd
- 4417 Bandy Rd
- 5213 Rock Hill Dr
- 4315 Bandy Rd
- 3983 Sterling Rd
- 3980 Sterling Rd
- 5217 Rock Hill Dr
- 4414 Bandy Rd
- 4303 Bandy Rd
- 5261 Rock Hill Dr
- 3976 Sterling Rd
- 4301 Bandy Rd
- 3965 Sterling Rd
- 4327 Rakes Rd
- 4291 Bandy Rd
- 5208 Lewis Rd
- 5227 Rock Hill Dr
- 3955 Sterling Rd