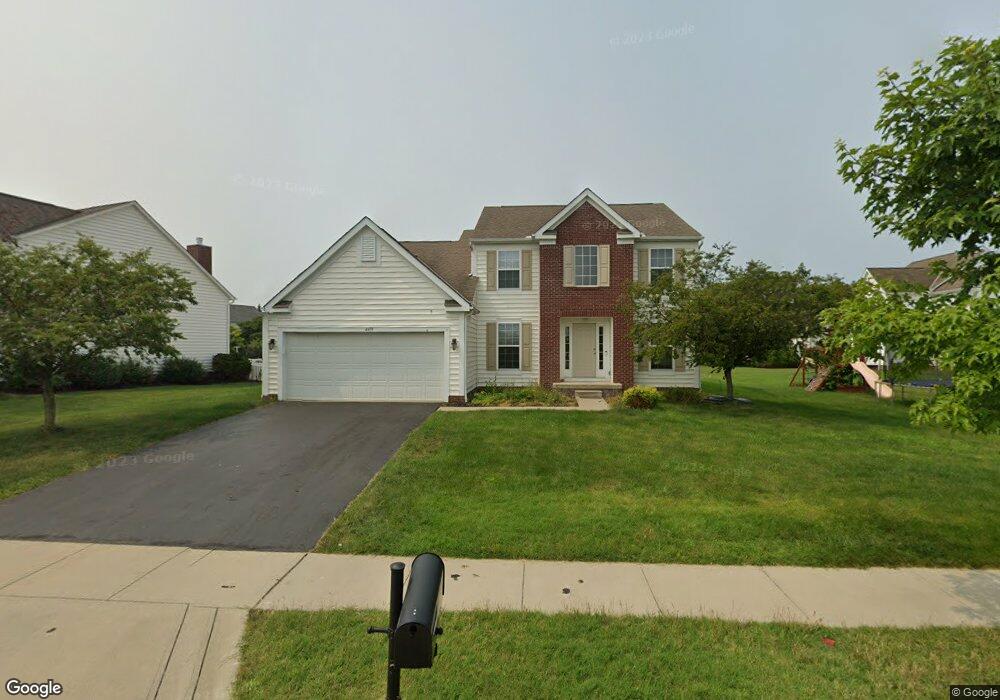
4419 Creekbend Dr Hilliard, OH 43026
Estimated Value: $528,009 - $611,000
4
Beds
3
Baths
2,360
Sq Ft
$239/Sq Ft
Est. Value
About This Home
This home is located at 4419 Creekbend Dr, Hilliard, OH 43026 and is currently estimated at $564,752, approximately $239 per square foot. 4419 Creekbend Dr is a home located in Franklin County with nearby schools including Hoffman Trails Elementary School, Hilliard Station Sixth Grade Elementary School, and Hilliard Heritage Middle School.
Ownership History
Date
Name
Owned For
Owner Type
Purchase Details
Closed on
Feb 4, 2009
Sold by
Sovereign Development Corporation
Bought by
Kurapati Ramakrishna R and Puvvada Pavani N
Current Estimated Value
Home Financials for this Owner
Home Financials are based on the most recent Mortgage that was taken out on this home.
Original Mortgage
$258,088
Outstanding Balance
$162,968
Interest Rate
5.08%
Mortgage Type
FHA
Estimated Equity
$401,784
Purchase Details
Closed on
Oct 24, 2008
Sold by
Rockford Homes Inc
Bought by
Sovereign Development Corporation
Home Financials for this Owner
Home Financials are based on the most recent Mortgage that was taken out on this home.
Original Mortgage
$218,400
Interest Rate
6.11%
Mortgage Type
Construction
Purchase Details
Closed on
Sep 23, 2005
Sold by
C V Land Ii Llc
Bought by
Rockford Homes Inc
Purchase Details
Closed on
Mar 19, 2004
Sold by
C V Perry & Co
Bought by
C V Land Ii Llc
Create a Home Valuation Report for This Property
The Home Valuation Report is an in-depth analysis detailing your home's value as well as a comparison with similar homes in the area
Home Values in the Area
Average Home Value in this Area
Purchase History
| Date | Buyer | Sale Price | Title Company |
|---|---|---|---|
| Kurapati Ramakrishna R | $267,000 | Attorney | |
| Sovereign Development Corporation | $65,000 | Attorney | |
| Rockford Homes Inc | $142,000 | Trinity Tit | |
| C V Land Ii Llc | -- | Arlington Title |
Source: Public Records
Mortgage History
| Date | Status | Borrower | Loan Amount |
|---|---|---|---|
| Open | Kurapati Ramakrishna R | $258,088 | |
| Closed | Sovereign Development Corporation | $218,400 |
Source: Public Records
Tax History Compared to Growth
Tax History
| Year | Tax Paid | Tax Assessment Tax Assessment Total Assessment is a certain percentage of the fair market value that is determined by local assessors to be the total taxable value of land and additions on the property. | Land | Improvement |
|---|---|---|---|---|
| 2024 | $9,587 | $143,120 | $38,500 | $104,620 |
| 2023 | $7,806 | $143,115 | $38,500 | $104,615 |
| 2022 | $7,460 | $108,860 | $28,180 | $80,680 |
| 2021 | $7,455 | $108,860 | $28,180 | $80,680 |
| 2020 | $7,437 | $108,860 | $28,180 | $80,680 |
| 2019 | $7,616 | $94,890 | $24,500 | $70,390 |
| 2018 | $7,834 | $94,890 | $24,500 | $70,390 |
| 2017 | $8,071 | $94,890 | $24,500 | $70,390 |
| 2016 | $8,554 | $99,020 | $26,990 | $72,030 |
| 2015 | $8,079 | $99,020 | $26,990 | $72,030 |
| 2014 | $8,093 | $99,020 | $26,990 | $72,030 |
| 2013 | $3,910 | $94,290 | $25,690 | $68,600 |
Source: Public Records
Map
Nearby Homes
- 6185 Ray's Way
- 6172 Ray's Way Unit 19
- 6110 Parkmeadow Ln
- 6228 Parkmeadow Ln
- 5935 Pondview Ct
- 5994 Farmcreek Ct
- 6223 Pollard Place Dr
- 4206 Coventry Manor Way
- 5806 Barbara Dr
- 6504 Shadewater Dr
- 4093 Greenbelt Dr
- 5633 Maple Dell Ct
- 5628 Weston Trail Dr
- 4180 Elliott Rd
- 6580 Davis Rd
- 6451 Whitewater Way
- 4509 Nonius Dr
- 6952 Corsican Loop N
- 6950 Corsican Loop N
- 6954 Corsican Loop N
- 4409 Creekbend Dr
- 6119 Woodsview Way
- 6127 Woodsview Way
- 6135 Woodsview Way
- 4395 Creekbend Dr
- 6122 Janes Way
- 6130 Janes Way
- 6143 Woodsview Way
- 4385 Creekbend Dr
- 6142 Janes Way
- 6157 Woodsview Way
- 6150 Janes Way
- 6158 Janes Way
- 6119 Janes Way
- 6165 Woodsview Way
- 6107 Janes Way
- 6127 Janes Way
- 6137 Janes Way
- 6091 Rays Way Unit 1
- 6166 Janes Way