--
Bed
--
Bath
5,587
Sq Ft
0.46
Acres
About This Home
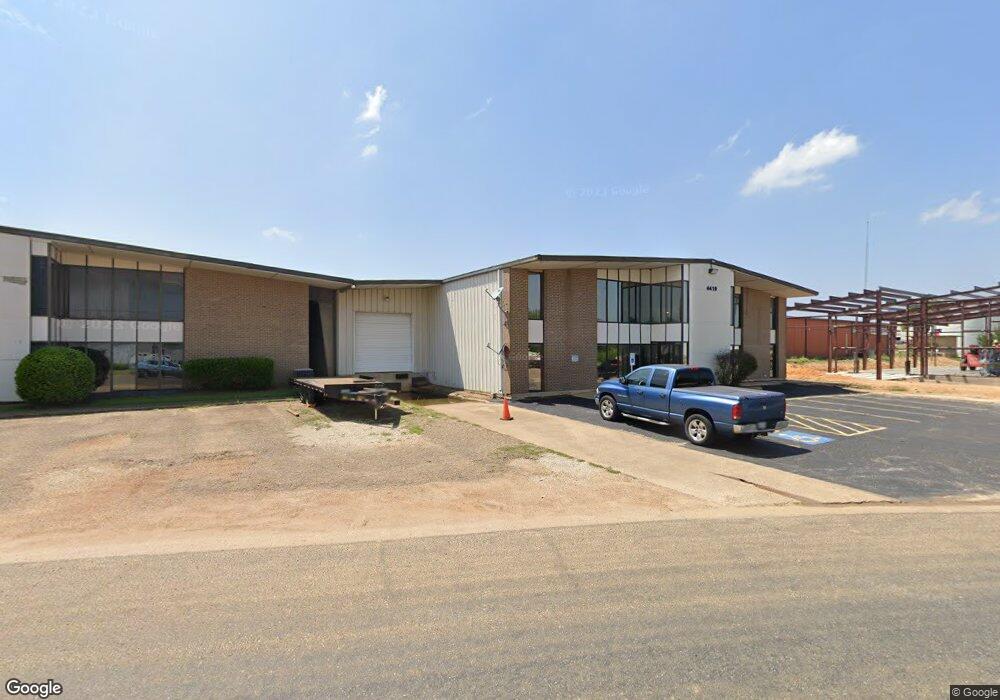
This home is located at 4419 Dc Dr, Tyler, TX 75701. 4419 Dc Dr is a home located in Smith County with nearby schools including Rice Elementary School, Three Lakes Middle School, and Tyler Legacy High School.
Ownership History
Date
Name
Owned For
Owner Type
Purchase Details
Closed on
Feb 2, 2018
Sold by
Soules Johnny Edward
Bought by
Soules Johnny Edward and Johnny Edward Soules Trust
Home Financials for this Owner
Home Financials are based on the most recent Mortgage that was taken out on this home.
Original Mortgage
$500,000
Outstanding Balance
$278,358
Interest Rate
3.94%
Mortgage Type
Future Advance Clause Open End Mortgage
Purchase Details
Closed on
Jul 21, 2014
Sold by
Bosworth Michael and Bosworth Susan A
Bought by
Mbar Properties Llc
Home Financials for this Owner
Home Financials are based on the most recent Mortgage that was taken out on this home.
Original Mortgage
$132,750
Interest Rate
4.23%
Mortgage Type
Commercial
Purchase Details
Closed on
Jan 30, 2006
Sold by
George Richard A and George Carol
Bought by
Bosworth Michael and Bosworth Susan A
Home Financials for this Owner
Home Financials are based on the most recent Mortgage that was taken out on this home.
Original Mortgage
$75,437
Interest Rate
6.24%
Mortgage Type
Commercial
Create a Home Valuation Report for This Property
The Home Valuation Report is an in-depth analysis detailing your home's value as well as a comparison with similar homes in the area
Home Values in the Area
Average Home Value in this Area
Purchase History
| Date | Buyer | Sale Price | Title Company |
|---|---|---|---|
| Soules Johnny Edward | -- | None Available | |
| Mbar Properties Llc | -- | None Available | |
| Bosworth Michael | -- | None Available | |
| Bosworth Michael | -- | None Available |
Source: Public Records
Mortgage History
| Date | Status | Borrower | Loan Amount |
|---|---|---|---|
| Open | Soules Johnny Edward | $500,000 | |
| Closed | Mbar Properties Llc | $132,750 | |
| Previous Owner | Bosworth Michael | $75,437 |
Source: Public Records
Tax History Compared to Growth
Tax History
| Year | Tax Paid | Tax Assessment Tax Assessment Total Assessment is a certain percentage of the fair market value that is determined by local assessors to be the total taxable value of land and additions on the property. | Land | Improvement |
|---|---|---|---|---|
| 2025 | $3,891 | $560,463 | $60,639 | $499,824 |
| 2024 | $3,891 | $228,719 | $60,639 | $203,749 |
| 2023 | $3,322 | $190,599 | $41,639 | $148,960 |
| 2022 | $3,291 | $167,986 | $41,639 | $126,347 |
| 2021 | $3,685 | $175,625 | $41,639 | $133,986 |
| 2020 | $3,731 | $174,364 | $41,639 | $132,725 |
| 2019 | $3,946 | $180,435 | $41,639 | $138,796 |
| 2018 | $4,057 | $186,545 | $41,639 | $144,906 |
| 2017 | $4,112 | $192,616 | $41,639 | $150,977 |
| 2016 | $4,266 | $199,832 | $41,639 | $158,193 |
| 2015 | $4,506 | $212,052 | $41,639 | $170,413 |
| 2014 | $4,506 | $212,052 | $41,639 | $170,413 |
Source: Public Records
Map
Nearby Homes
- 1521 Rice Rd
- 1521 Rice Rd Unit Z104
- 1521 Rice Rd Unit E105
- 3903 Appletree Ln
- 1408 Woodbridge Dr
- 4001 Darrell Ln
- 1107 Larkspur Ln
- 1531 Woodland Hills Dr
- 3915 Post Oak Rd
- 1202 Rice Rd
- 1317 Woodland Hills Dr
- 3829 Cloverdale Dr
- 842 Carriage Dr
- 5290 Tyler Park Dr
- 5106 Cloverdale Dr
- 6111 Hamilton Meadows Way
- 5401 Hollytree Dr
- 4425 Dc Dr
- 4409 Dc Dr
- 4410 Dc Dr
- 2004 Broussard St
- 2001 Patridge Dr
- 2001 2001 Patridge
- 2012 Anthony Dr
- 4504 Candy Ln
- 2011 Patridge St
- 2006 Patridge St
- 2006 Patridge Dr
- 2008 Patridge St
- 4616 Dc Dr
- 1702 W Southwest Loop 323
- 2122 Anthony Dr
- 2128 Anthony Dr
- 2128 Anthony Dr Unit D & E
- 2128 2128 Anthony Dr
- 2121 Anthony Dr
- 4623 Candy Ln