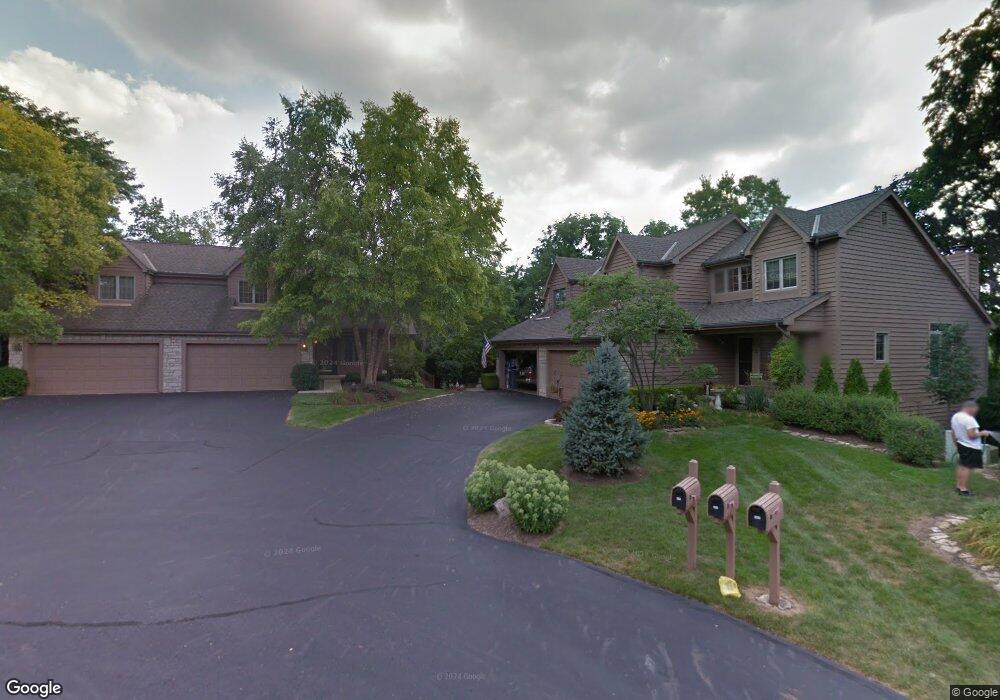
4419 Zachary Ct Dublin, OH 43017
Estimated Value: $387,000 - $489,000
3
Beds
3
Baths
1,633
Sq Ft
$272/Sq Ft
Est. Value
About This Home
This home is located at 4419 Zachary Ct, Dublin, OH 43017 and is currently estimated at $444,437, approximately $272 per square foot. 4419 Zachary Ct is a home located in Franklin County with nearby schools including Riverside Elementary School, Ann Simpson Davis Middle School, and Dublin Scioto High School.
Ownership History
Date
Name
Owned For
Owner Type
Purchase Details
Closed on
Dec 18, 2003
Sold by
Alpiger Virginia Brady and Brady Virginia A
Bought by
Pagnanelli Edward and Iacovetta Sandra
Current Estimated Value
Purchase Details
Closed on
Feb 23, 2001
Sold by
Alpiger Glenn W
Bought by
Alpiger Virginia Brady
Home Financials for this Owner
Home Financials are based on the most recent Mortgage that was taken out on this home.
Original Mortgage
$176,000
Outstanding Balance
$64,278
Interest Rate
7.06%
Estimated Equity
$380,159
Purchase Details
Closed on
Oct 5, 2000
Sold by
Mccune Janet S & Harold E Co Trs
Bought by
Alpiger Glenn W and Alpiger Virginia Brady
Purchase Details
Closed on
Dec 7, 1998
Sold by
Mccrabb Janet S and Mccune Janet S
Bought by
Mccune Janet S and Mccune Harold E
Purchase Details
Closed on
Mar 11, 1991
Bought by
Mccrabb Janet S
Create a Home Valuation Report for This Property
The Home Valuation Report is an in-depth analysis detailing your home's value as well as a comparison with similar homes in the area
Home Values in the Area
Average Home Value in this Area
Purchase History
| Date | Buyer | Sale Price | Title Company |
|---|---|---|---|
| Pagnanelli Edward | $250,000 | -- | |
| Alpiger Virginia Brady | -- | -- | |
| Alpiger Glenn W | $199,500 | -- | |
| Mccune Janet S | -- | -- | |
| Mccrabb Janet S | $163,800 | -- |
Source: Public Records
Mortgage History
| Date | Status | Borrower | Loan Amount |
|---|---|---|---|
| Open | Alpiger Virginia Brady | $176,000 |
Source: Public Records
Tax History Compared to Growth
Tax History
| Year | Tax Paid | Tax Assessment Tax Assessment Total Assessment is a certain percentage of the fair market value that is determined by local assessors to be the total taxable value of land and additions on the property. | Land | Improvement |
|---|---|---|---|---|
| 2024 | $8,786 | $145,040 | $51,450 | $93,590 |
| 2023 | $8,705 | $145,040 | $51,450 | $93,590 |
| 2022 | $8,162 | $85,050 | $15,400 | $69,650 |
| 2021 | $5,361 | $85,050 | $15,400 | $69,650 |
| 2020 | $5,405 | $85,050 | $15,400 | $69,650 |
| 2019 | $5,500 | $77,420 | $14,000 | $63,420 |
| 2018 | $5,209 | $77,420 | $14,000 | $63,420 |
| 2017 | $4,991 | $77,420 | $14,000 | $63,420 |
| 2016 | $4,863 | $70,000 | $17,570 | $52,430 |
| 2015 | $4,894 | $70,000 | $17,570 | $52,430 |
| 2014 | $4,900 | $70,000 | $17,570 | $52,430 |
| 2013 | $2,727 | $75,740 | $17,570 | $58,170 |
Source: Public Records
Map
Nearby Homes
- 3370 Kendelmarie Way
- 143 S Riverview St
- 3230 Brampton St
- 6802 Chesley Rd
- 6052 Dublin Rd
- 3154 Rimmer Dr
- 6549 Brock St
- 6737 Riverside Glen Ct
- 6640 Mooney St Unit 412
- 6640 Mooney St Unit 212
- 6527 Quarry Ln
- 6585 Delburn Ct
- 3334 Edgebrook Dr
- 4231 Troutbrook Dr
- 6383 Dummerston Ct
- 6730 Dublin Rd
- 3107 Hamden Ct
- 390 Edinburgh Rd
- 4187 Rings Rd
- 4197 Mccune Ave Unit Lot 702
- 4421 Zachary Ct
- 4417 Zachary Ct
- 4422 Zachary Ct
- 4413 Zachary Ct
- 4420 Zachary Ct
- 4409 Zachary Ct
- 4418 Zachary Ct
- 4414 Zachary Ct
- 4403 Zachary Ct
- 6170 Riverside Dr
- 6180 Riverside Dr
- 4408 Zachary Ct
- 4401 Zachary Ct
- 4400 Zachary Ct
- 6241 Riverside Dr
- 4399 Zachary Ct
- 6233 Riverside Dr
- 4397 Zachary Ct
- 6253 Riverside Dr
- 4395 Zachary Ct