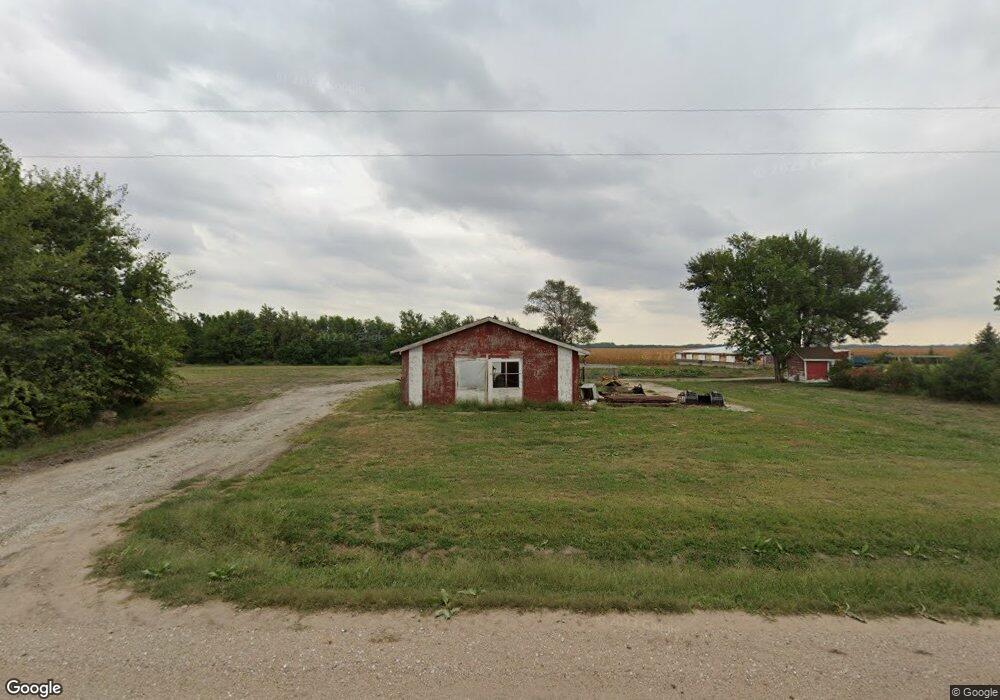
442 364th Beaver Crossing, NE 68313
Estimated Value: $191,000 - $314,000
3
Beds
1
Bath
1,370
Sq Ft
$184/Sq Ft
Est. Value
About This Home
This home is located at 442 364th, Beaver Crossing, NE 68313 and is currently estimated at $252,057, approximately $183 per square foot. 442 364th is a home located in Seward County with nearby schools including Centennial Elementary School and Centennial High School.
Ownership History
Date
Name
Owned For
Owner Type
Purchase Details
Closed on
Mar 21, 2024
Sold by
Roth Tyler and Roth Madison
Bought by
Scott Dale L and Mueller Linda Kay
Current Estimated Value
Purchase Details
Closed on
Mar 11, 2024
Sold by
Roth Tyler and Roth Madison
Bought by
Roth Tyler and Roth Madison
Purchase Details
Closed on
Apr 12, 2022
Sold by
Roth Kevin N and Lea Terri
Bought by
Roth Tyler
Purchase Details
Closed on
May 25, 2021
Sold by
Stauffer Mahlon and Stauffer Nolan W
Bought by
Roth Kevin N and Roth Terri L
Home Financials for this Owner
Home Financials are based on the most recent Mortgage that was taken out on this home.
Original Mortgage
$320,000
Interest Rate
3%
Mortgage Type
Future Advance Clause Open End Mortgage
Purchase Details
Closed on
May 14, 2020
Sold by
Roth Kevin N and Roth Tori L
Bought by
Roth Tyler
Home Financials for this Owner
Home Financials are based on the most recent Mortgage that was taken out on this home.
Original Mortgage
$246,500
Interest Rate
3.3%
Mortgage Type
Future Advance Clause Open End Mortgage
Create a Home Valuation Report for This Property
The Home Valuation Report is an in-depth analysis detailing your home's value as well as a comparison with similar homes in the area
Home Values in the Area
Average Home Value in this Area
Purchase History
| Date | Buyer | Sale Price | Title Company |
|---|---|---|---|
| Scott Dale L | $10,000 | None Listed On Document | |
| Roth Tyler | -- | None Listed On Document | |
| Roth Tyler | -- | None Listed On Document | |
| Roth Kevin N | $320,000 | Title Svcs Of Blue Valley | |
| Roth Tyler | $493,000 | Title Svcs Of Blue Valley Ll |
Source: Public Records
Mortgage History
| Date | Status | Borrower | Loan Amount |
|---|---|---|---|
| Previous Owner | Roth Kevin N | $320,000 | |
| Previous Owner | Roth Tyler | $246,500 |
Source: Public Records
Tax History Compared to Growth
Tax History
| Year | Tax Paid | Tax Assessment Tax Assessment Total Assessment is a certain percentage of the fair market value that is determined by local assessors to be the total taxable value of land and additions on the property. | Land | Improvement |
|---|---|---|---|---|
| 2024 | $1,109 | $174,344 | $38,600 | $135,744 |
| 2023 | $1,548 | $174,344 | $38,600 | $135,744 |
| 2022 | $1,565 | $164,249 | $36,600 | $127,649 |
| 2021 | $1,506 | $164,249 | $36,600 | $127,649 |
| 2020 | $1,429 | $159,249 | $31,600 | $127,649 |
| 2019 | $1,382 | $159,249 | $31,600 | $127,649 |
| 2018 | $1,293 | $151,678 | $31,600 | $120,078 |
| 2017 | $1,283 | $121,540 | $31,600 | $89,940 |
| 2016 | $1,120 | $138,813 | $31,600 | $107,213 |
| 2015 | $1,132 | $138,813 | $31,600 | $107,213 |
| 2013 | $1,333 | $134,733 | $27,520 | $107,213 |
Source: Public Records
Map
Nearby Homes