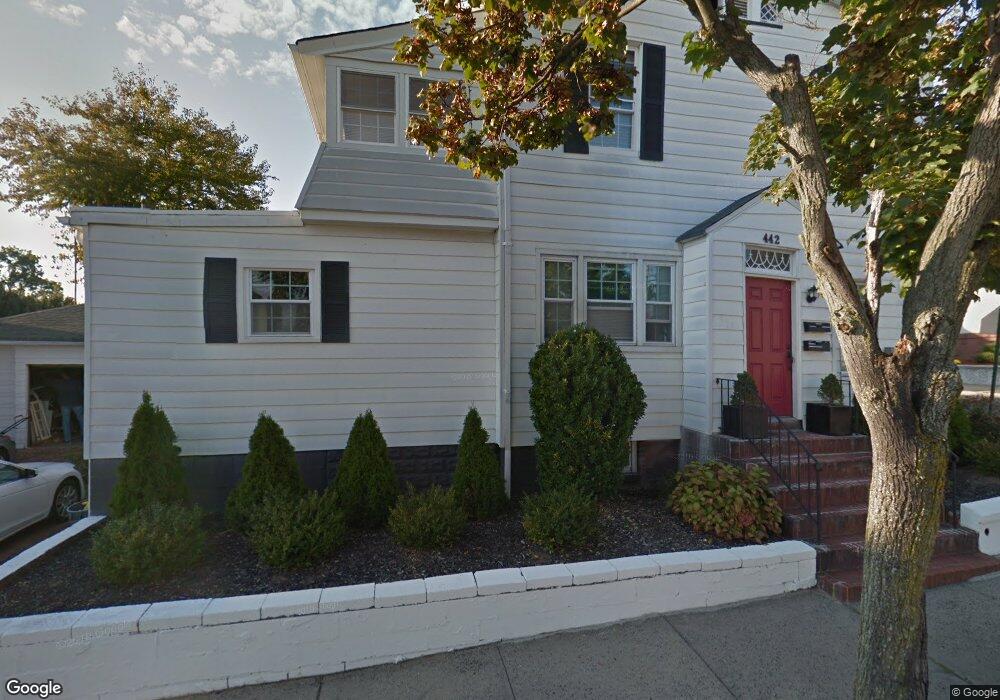
442 3rd St Carlstadt, NJ 07072
Estimated Value: $915,427 - $1,204,000
2
Beds
1
Bath
2,128
Sq Ft
$477/Sq Ft
Est. Value
About This Home
This home is located at 442 3rd St, Carlstadt, NJ 07072 and is currently estimated at $1,015,607, approximately $477 per square foot. 442 3rd St is a home located in Bergen County with nearby schools including Carlstadt Public School, Henry P Becton Regional High School, and Montessori School of East Rutherford.
Ownership History
Date
Name
Owned For
Owner Type
Purchase Details
Closed on
Oct 5, 2021
Sold by
Ekrem Yucebilgic
Bought by
Almonte Jesse and Rosas April
Current Estimated Value
Home Financials for this Owner
Home Financials are based on the most recent Mortgage that was taken out on this home.
Original Mortgage
$741,325
Interest Rate
3.12%
Mortgage Type
FHA
Purchase Details
Closed on
Dec 14, 2012
Sold by
Karahan Kemal and Karaham Kemal
Bought by
Yucebilgic Ekrem
Create a Home Valuation Report for This Property
The Home Valuation Report is an in-depth analysis detailing your home's value as well as a comparison with similar homes in the area
Home Values in the Area
Average Home Value in this Area
Purchase History
| Date | Buyer | Sale Price | Title Company |
|---|---|---|---|
| Almonte Jesse | $755,000 | New Jersey Land Title | |
| Yucebilgic Ekrem | $183,385 | -- |
Source: Public Records
Mortgage History
| Date | Status | Borrower | Loan Amount |
|---|---|---|---|
| Previous Owner | Almonte Jesse | $741,325 |
Source: Public Records
Tax History Compared to Growth
Tax History
| Year | Tax Paid | Tax Assessment Tax Assessment Total Assessment is a certain percentage of the fair market value that is determined by local assessors to be the total taxable value of land and additions on the property. | Land | Improvement |
|---|---|---|---|---|
| 2025 | $13,379 | $837,800 | $239,600 | $598,200 |
| 2024 | $12,189 | $805,500 | $227,100 | $578,400 |
| 2023 | $11,470 | $741,000 | $199,600 | $541,400 |
| 2022 | $11,470 | $679,500 | $183,000 | $496,500 |
| 2021 | $7,674 | $423,300 | $170,500 | $252,800 |
| 2020 | $6,988 | $393,700 | $165,500 | $228,200 |
| 2019 | $6,905 | $376,300 | $163,000 | $213,300 |
| 2018 | $7,127 | $370,800 | $160,500 | $210,300 |
| 2017 | $6,932 | $363,700 | $158,000 | $205,700 |
| 2016 | $7,441 | $350,000 | $149,500 | $200,500 |
| 2015 | $7,245 | $350,000 | $149,500 | $200,500 |
| 2014 | $7,763 | $389,900 | $149,500 | $240,400 |
Source: Public Records
Map
Nearby Homes