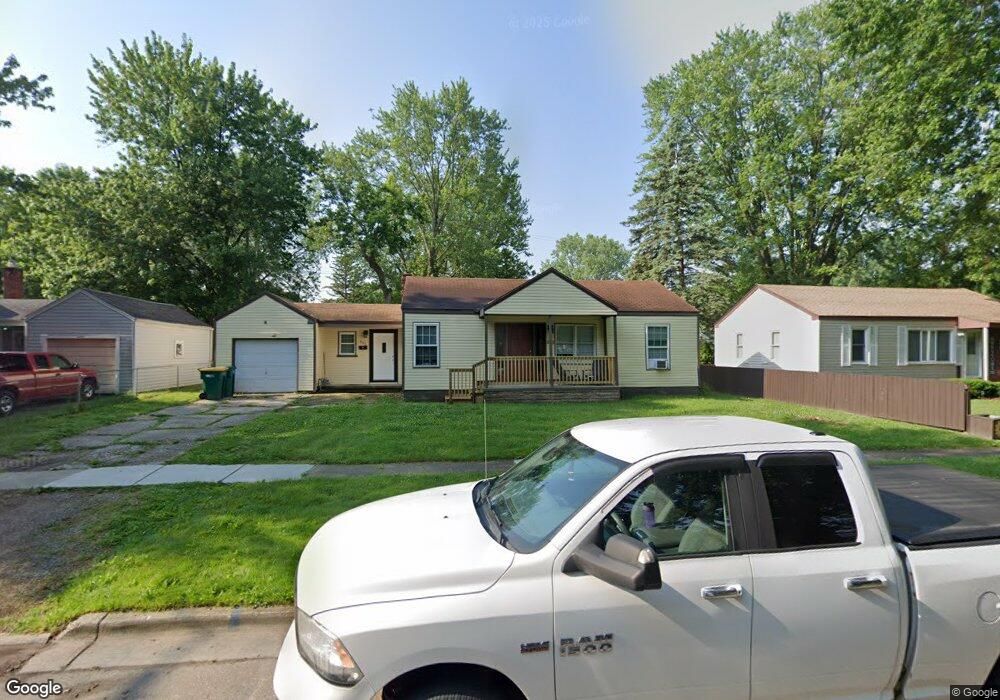
442 Beach St Mount Morris, MI 48458
Estimated Value: $74,000 - $147,000
3
Beds
1
Bath
972
Sq Ft
$122/Sq Ft
Est. Value
About This Home
This home is located at 442 Beach St, Mount Morris, MI 48458 and is currently estimated at $118,105, approximately $121 per square foot. 442 Beach St is a home located in Genesee County with nearby schools including Elisabeth Ann Johnson High School and St. Mary's School.
Ownership History
Date
Name
Owned For
Owner Type
Purchase Details
Closed on
Jun 6, 2024
Sold by
Jarrard John
Bought by
Jww Investments Llc
Current Estimated Value
Home Financials for this Owner
Home Financials are based on the most recent Mortgage that was taken out on this home.
Original Mortgage
$37,572
Outstanding Balance
$36,975
Interest Rate
7.17%
Mortgage Type
New Conventional
Estimated Equity
$81,130
Purchase Details
Closed on
Feb 14, 2024
Sold by
Genesee County
Bought by
Dort Financial Credit Union
Purchase Details
Closed on
May 9, 2014
Sold by
Powell Maynard T
Bought by
Wilson Albert A
Purchase Details
Closed on
Sep 19, 2013
Sold by
Renner Bryan and Renner Carrie
Bought by
Powell Maynard T
Purchase Details
Closed on
Sep 18, 2013
Sold by
Papineau Terry Raymond and Papineau Cindy Marguerite
Bought by
Renner Bryan
Purchase Details
Closed on
Dec 12, 2012
Sold by
City Of Mount Morris
Bought by
Papineau Terry R and Papineau Cindy M
Create a Home Valuation Report for This Property
The Home Valuation Report is an in-depth analysis detailing your home's value as well as a comparison with similar homes in the area
Home Values in the Area
Average Home Value in this Area
Purchase History
| Date | Buyer | Sale Price | Title Company |
|---|---|---|---|
| Jww Investments Llc | -- | Liberty Title | |
| Jww Investments Llc | -- | Liberty Title | |
| Dort Financial Credit Union | $32,039 | None Listed On Document | |
| Wilson Albert A | -- | Cislo Title Company | |
| Powell Maynard T | $500 | Greco Title | |
| Renner Bryan | $1,500 | Greco Title | |
| Papineau Terry R | $1,500 | None Available |
Source: Public Records
Mortgage History
| Date | Status | Borrower | Loan Amount |
|---|---|---|---|
| Open | Jww Investments Llc | $37,572 | |
| Closed | Jww Investments Llc | $37,572 |
Source: Public Records
Tax History
| Year | Tax Paid | Tax Assessment Tax Assessment Total Assessment is a certain percentage of the fair market value that is determined by local assessors to be the total taxable value of land and additions on the property. | Land | Improvement |
|---|---|---|---|---|
| 2025 | $485 | $40,100 | $0 | $0 |
| 2024 | $328 | $38,000 | $0 | $0 |
| 2023 | $314 | $17,100 | $0 | $0 |
| 2022 | $988 | $14,200 | $0 | $0 |
| 2021 | $965 | $12,800 | $0 | $0 |
| 2020 | $822 | $12,300 | $0 | $0 |
| 2019 | $817 | $11,400 | $0 | $0 |
| 2018 | $744 | $9,600 | $0 | $0 |
| 2017 | $513 | $9,800 | $0 | $0 |
| 2016 | $635 | $7,800 | $0 | $0 |
| 2015 | -- | $7,500 | $0 | $0 |
| 2014 | -- | $7,800 | $0 | $0 |
| 2012 | -- | $0 | $0 | $0 |
Source: Public Records
Map
Nearby Homes
- 335 Beach St
- 7230 Harvard Ave
- 328 W Mount Morris St
- 11145 N Saginaw St
- 705 Maple St
- V/L Saginaw St
- 11916 Saginaw St
- 7151 Estrelle Ave
- 4181 E Mount Morris Rd
- 5372 W Mount Morris Rd
- 12210 W Washington Ave
- 1477 W Mt Morris Rd
- 8151 Benson Rd
- 7031 Harvard Ave
- 643 Roosevelt Ave
- 1501 Mount Morris Rd
- 1032 Maginn Ct
- 7363 Neff Rd
- 1122 Howard St
- 8250 Rockwood Ave
Your Personal Tour Guide
Ask me questions while you tour the home.