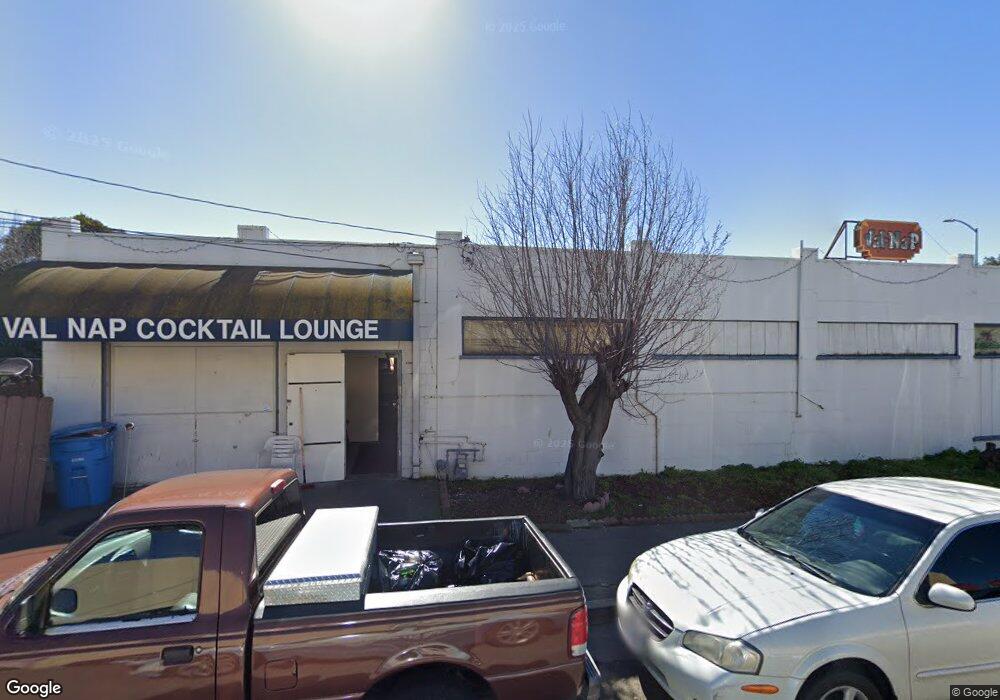
442 Broadway Vallejo, CA 94590
Vallejo Heights Neighborhood
Studio
--
Bath
3,150
Sq Ft
6,098
Sq Ft Lot
About This Home
This home is located at 442 Broadway, Vallejo, CA 94590. 442 Broadway is a home located in Solano County with nearby schools including Highland Elementary, Vallejo High School, and Caliber: ChangeMakers Academy.
Ownership History
Date
Name
Owned For
Owner Type
Purchase Details
Closed on
Jun 3, 2022
Sold by
Uriel Guerrero
Bought by
Guanajuato Market Inc
Purchase Details
Closed on
Jun 22, 2018
Sold by
Fonseca Monica M
Bought by
Guerrero Uriel
Purchase Details
Closed on
Jul 23, 2017
Sold by
Guerrero Karla Elsy Salazar De
Bought by
Guerrero Uriel
Purchase Details
Closed on
May 13, 2008
Sold by
Fonseca Monica M and Susan P Zalesky Trust
Bought by
Fonseca Monica M
Purchase Details
Closed on
Jun 6, 2002
Sold by
Zalesky Susan P
Bought by
Zalesky Susan P and Susan P Zalesky Trust
Purchase Details
Closed on
Mar 15, 2002
Sold by
Ewing Teresa L and Ewing Family Exemption Trust
Bought by
Zalesky Susan P
Create a Home Valuation Report for This Property
The Home Valuation Report is an in-depth analysis detailing your home's value as well as a comparison with similar homes in the area
Home Values in the Area
Average Home Value in this Area
Purchase History
| Date | Buyer | Sale Price | Title Company |
|---|---|---|---|
| Guanajuato Market Inc | $300,000 | Old Republic Title | |
| Guerrero Uriel | $373,000 | Old Republic Title Co | |
| Guerrero Uriel | -- | Old Republic Title Co | |
| Fonseca Monica M | -- | None Available | |
| Zalesky Susan P | -- | -- | |
| Zalesky Susan P | $157,000 | Frontier Title Company |
Source: Public Records
Tax History
| Year | Tax Paid | Tax Assessment Tax Assessment Total Assessment is a certain percentage of the fair market value that is determined by local assessors to be the total taxable value of land and additions on the property. | Land | Improvement |
|---|---|---|---|---|
| 2025 | $8,338 | $482,849 | $153,875 | $328,974 |
| 2024 | $8,338 | $523,382 | $150,858 | $372,524 |
| 2023 | $7,179 | $508,100 | $147,900 | $360,200 |
| 2022 | $6,690 | $40,000 | $0 | $40,000 |
| 2021 | $6,533 | $424,400 | $103,056 | $321,344 |
| 2020 | $7,896 | $420,460 | $102,000 | $318,460 |
| 2019 | $6,677 | $413,000 | $100,000 | $313,000 |
| 2018 | $4,471 | $211,591 | $101,270 | $110,321 |
| 2017 | $3,790 | $208,887 | $99,285 | $109,602 |
| 2016 | $2,571 | $214,352 | $97,339 | $117,013 |
| 2015 | $2,541 | $211,410 | $95,877 | $115,533 |
| 2014 | $2,448 | $207,630 | $93,999 | $113,631 |
Source: Public Records
Map
Nearby Homes
- 900 Alameda St
- 1131 Tennessee St
- 327 Arkansas St
- 325 Arkansas St
- 1038 Alabama St
- 1158 Louisiana St
- 125 Broadway St
- 1208 Amador St
- 939 Ohio St
- 1314 Ohio St
- 918 Alameda St
- 844 Kentucky St
- 1322 Alabama St
- 215 Hampshire St
- 1322 Sutter St
- 729 Ohio St
- 2328 Napa St
- 17 Hanns Ave
- 1208 Florida St
- 0 Mississippi St
Your Personal Tour Guide
Ask me questions while you tour the home.