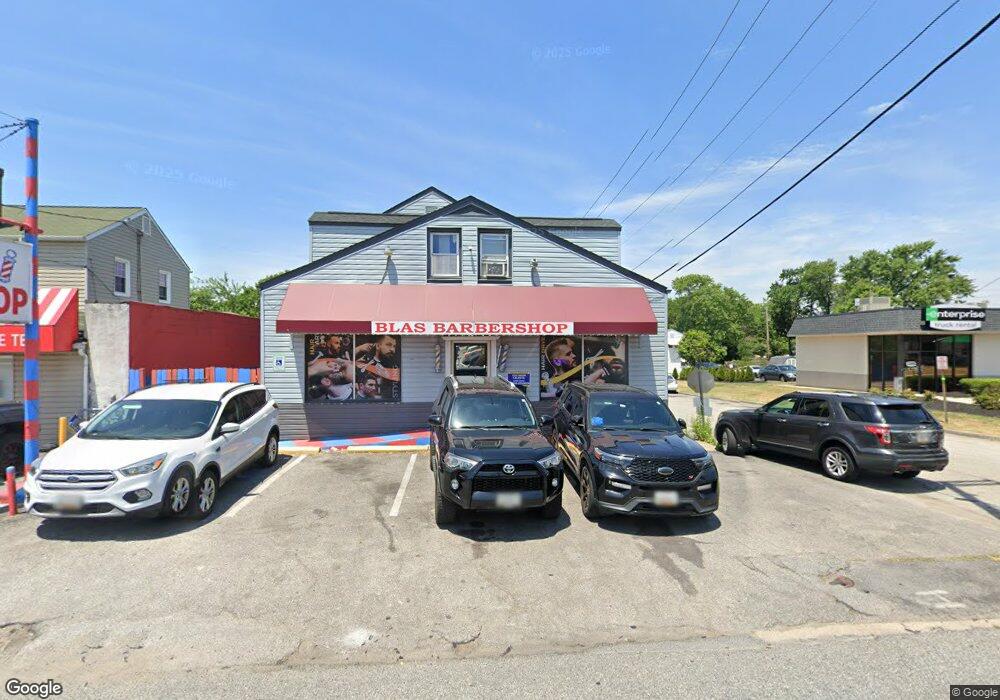
442 Crain Hwy N Glen Burnie, MD 21061
Estimated Value: $518,766 - $559,000
--
Bed
--
Bath
2,002
Sq Ft
$269/Sq Ft
Est. Value
About This Home
This home is located at 442 Crain Hwy N, Glen Burnie, MD 21061 and is currently estimated at $538,883, approximately $269 per square foot. 442 Crain Hwy N is a home located in Anne Arundel County with nearby schools including Richard Henry Lee Elementary School, Corkran Middle School, and Glen Burnie High School.
Ownership History
Date
Name
Owned For
Owner Type
Purchase Details
Closed on
Sep 7, 2018
Sold by
Jes Investment Llc
Bought by
Sanchez Llc
Current Estimated Value
Home Financials for this Owner
Home Financials are based on the most recent Mortgage that was taken out on this home.
Original Mortgage
$259,000
Outstanding Balance
$225,884
Interest Rate
4.6%
Mortgage Type
Commercial
Estimated Equity
$312,999
Purchase Details
Closed on
Sep 20, 2006
Sold by
Royer Robert L
Bought by
Yoo Sung and Yoo Jacklyn S
Home Financials for this Owner
Home Financials are based on the most recent Mortgage that was taken out on this home.
Original Mortgage
$175,000
Interest Rate
6.88%
Mortgage Type
Commercial
Purchase Details
Closed on
Aug 3, 2006
Sold by
Royer Robert L
Bought by
Yoo Sung and Yoo Jacklyn S
Home Financials for this Owner
Home Financials are based on the most recent Mortgage that was taken out on this home.
Original Mortgage
$175,000
Interest Rate
6.88%
Mortgage Type
Commercial
Purchase Details
Closed on
Jun 6, 1989
Sold by
Cykieta Anthony M
Bought by
Royer Robert L
Home Financials for this Owner
Home Financials are based on the most recent Mortgage that was taken out on this home.
Original Mortgage
$25,000
Interest Rate
10.48%
Create a Home Valuation Report for This Property
The Home Valuation Report is an in-depth analysis detailing your home's value as well as a comparison with similar homes in the area
Home Values in the Area
Average Home Value in this Area
Purchase History
| Date | Buyer | Sale Price | Title Company |
|---|---|---|---|
| Sanchez Llc | $370,000 | Cardinal Title & Settlement | |
| Yoo Sung | $250,000 | -- | |
| Yoo Sung | $250,000 | -- | |
| Royer Robert L | $25,000 | -- |
Source: Public Records
Mortgage History
| Date | Status | Borrower | Loan Amount |
|---|---|---|---|
| Open | Sanchez Llc | $259,000 | |
| Previous Owner | Yoo Sung | $175,000 | |
| Previous Owner | Yoo Sung | $175,000 | |
| Previous Owner | Royer Robert L | $25,000 |
Source: Public Records
Tax History Compared to Growth
Tax History
| Year | Tax Paid | Tax Assessment Tax Assessment Total Assessment is a certain percentage of the fair market value that is determined by local assessors to be the total taxable value of land and additions on the property. | Land | Improvement |
|---|---|---|---|---|
| 2025 | $5,656 | $389,800 | $278,700 | $111,100 |
| 2024 | $5,656 | $386,167 | $0 | $0 |
| 2023 | $5,522 | $382,533 | $0 | $0 |
| 2022 | $4,496 | $378,900 | $278,700 | $100,200 |
| 2021 | $4,409 | $375,633 | $0 | $0 |
| 2020 | $4,409 | $372,367 | $0 | $0 |
| 2019 | $4,380 | $369,100 | $278,700 | $90,400 |
| 2018 | $3,678 | $362,733 | $0 | $0 |
| 2017 | $4,100 | $356,367 | $0 | $0 |
| 2016 | -- | $350,000 | $0 | $0 |
| 2015 | -- | $315,033 | $0 | $0 |
| 2014 | -- | $280,067 | $0 | $0 |
Source: Public Records
Map
Nearby Homes
- 0 Ritchie Hwy
- 108 New Jersey Ave NW
- 310 New Jersey Ave NE
- 330 New Jersey Ave NE
- 412 6th Ave NE
- 102 Kent Rd
- 201 Central Ave
- 108 1st Ave SW
- 102 Kuethe Rd NE
- 7517 Baltimore Annapolis Blvd
- 133 Glen Rd
- 204 Carroll Rd
- 101 Kuethe Rd NE
- 102 Garrett Rd
- 933 Andrews Rd
- 100 3rd Ave SE
- 106 3rd Ave SE
- 454 Renfro Ct
- 898 Brighton Place
- 115 Dorchester Rd
- 442 Crain Hwy N
- 440 Crain Hwy N
- 438 Crain Hwy N
- 5 Virginia Ave NW
- 7 Virginia Ave NW
- 436 Crain Hwy N
- 800 Crain Hwy N
- 445 Crain Hwy N
- 502 Crain Hwy N
- 8 Virginia Ave NW
- 9 Virginia Ave NW
- 434 Crain Hwy N
- 7314 Ritchie Hwy
- 10 Virginia Ave NW
- 7316 Ritchie Hwy
- 432 Crain Hwy N
- 429 Browning Ct
- 12 Virginia Ave NW
- 433 Browning Ct
- 7310 Ritchie Hwy Unit 411