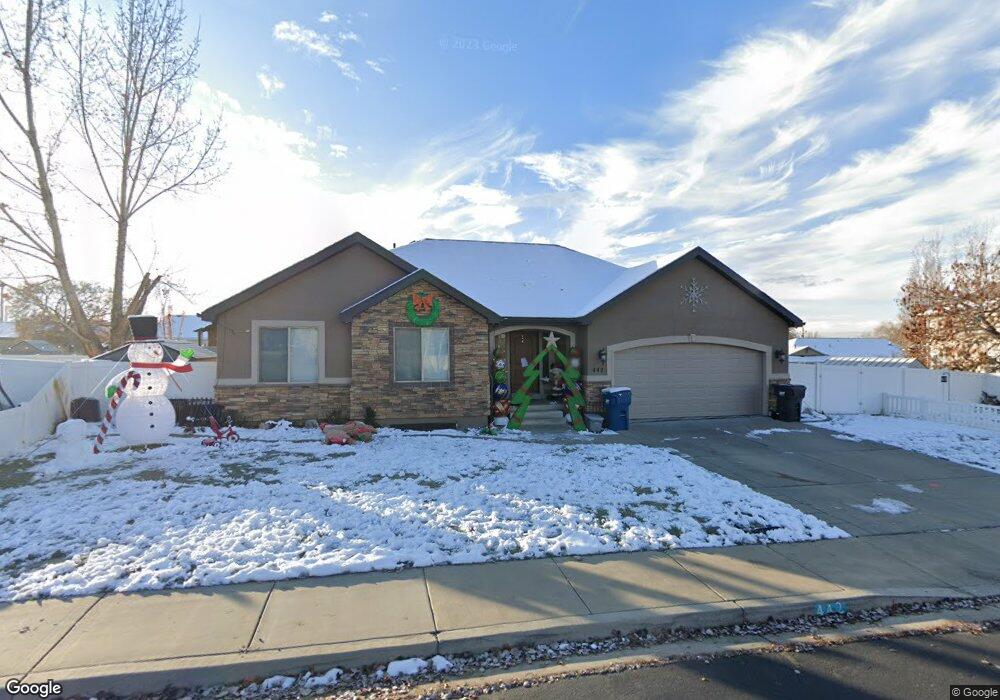
442 E 420 S Unit 7 Pleasant Grove, UT 84062
Estimated Value: $545,000 - $662,000
3
Beds
2
Baths
1,653
Sq Ft
$371/Sq Ft
Est. Value
About This Home
This home is located at 442 E 420 S Unit 7, Pleasant Grove, UT 84062 and is currently estimated at $613,466, approximately $371 per square foot. 442 E 420 S Unit 7 is a home located in Utah County with nearby schools including Central Elementary School, Pleasant Grove Junior High School, and Pleasant Grove High School.
Ownership History
Date
Name
Owned For
Owner Type
Purchase Details
Closed on
May 22, 2009
Sold by
Ren Enterprises Llc
Bought by
Sollis Christian P and Sollis Susanne Stoddard
Current Estimated Value
Home Financials for this Owner
Home Financials are based on the most recent Mortgage that was taken out on this home.
Original Mortgage
$245,000
Outstanding Balance
$154,546
Interest Rate
4.82%
Mortgage Type
Purchase Money Mortgage
Estimated Equity
$458,920
Purchase Details
Closed on
Dec 24, 2008
Sold by
Sourceone Financial Inc
Bought by
Ren Enterprises Llc and Prm Investment Company
Purchase Details
Closed on
Nov 21, 2008
Sold by
Ralston Investments Lc
Bought by
Sourceone Financial Inc
Purchase Details
Closed on
Aug 25, 2004
Sold by
Bethpage Lc
Bought by
Ralston Investments Llc
Create a Home Valuation Report for This Property
The Home Valuation Report is an in-depth analysis detailing your home's value as well as a comparison with similar homes in the area
Home Values in the Area
Average Home Value in this Area
Purchase History
| Date | Buyer | Sale Price | Title Company |
|---|---|---|---|
| Sollis Christian P | -- | Affiliated First Title Comp | |
| Ren Enterprises Llc | -- | Meridian Title Company | |
| Sourceone Financial Inc | -- | None Available | |
| Ralston Investments Llc | -- | Guardian Title Company Of U |
Source: Public Records
Mortgage History
| Date | Status | Borrower | Loan Amount |
|---|---|---|---|
| Open | Sollis Christian P | $245,000 |
Source: Public Records
Tax History Compared to Growth
Tax History
| Year | Tax Paid | Tax Assessment Tax Assessment Total Assessment is a certain percentage of the fair market value that is determined by local assessors to be the total taxable value of land and additions on the property. | Land | Improvement |
|---|---|---|---|---|
| 2025 | $2,559 | $319,770 | $285,100 | $296,300 |
| 2024 | $2,559 | $305,580 | $0 | $0 |
| 2023 | $2,543 | $310,750 | $0 | $0 |
| 2022 | $2,615 | $317,845 | $0 | $0 |
| 2021 | $2,275 | $421,100 | $162,200 | $258,900 |
| 2020 | $2,199 | $399,100 | $150,200 | $248,900 |
| 2019 | $2,089 | $392,100 | $143,200 | $248,900 |
| 2018 | $1,948 | $345,700 | $129,300 | $216,400 |
| 2017 | $2,008 | $189,695 | $0 | $0 |
| 2016 | $1,798 | $164,010 | $0 | $0 |
| 2015 | $1,618 | $139,755 | $0 | $0 |
| 2014 | $1,493 | $127,710 | $0 | $0 |
Source: Public Records
Map
Nearby Homes