Estimated Value: $117,000 - $151,000
2
Beds
1
Bath
1,131
Sq Ft
$123/Sq Ft
Est. Value
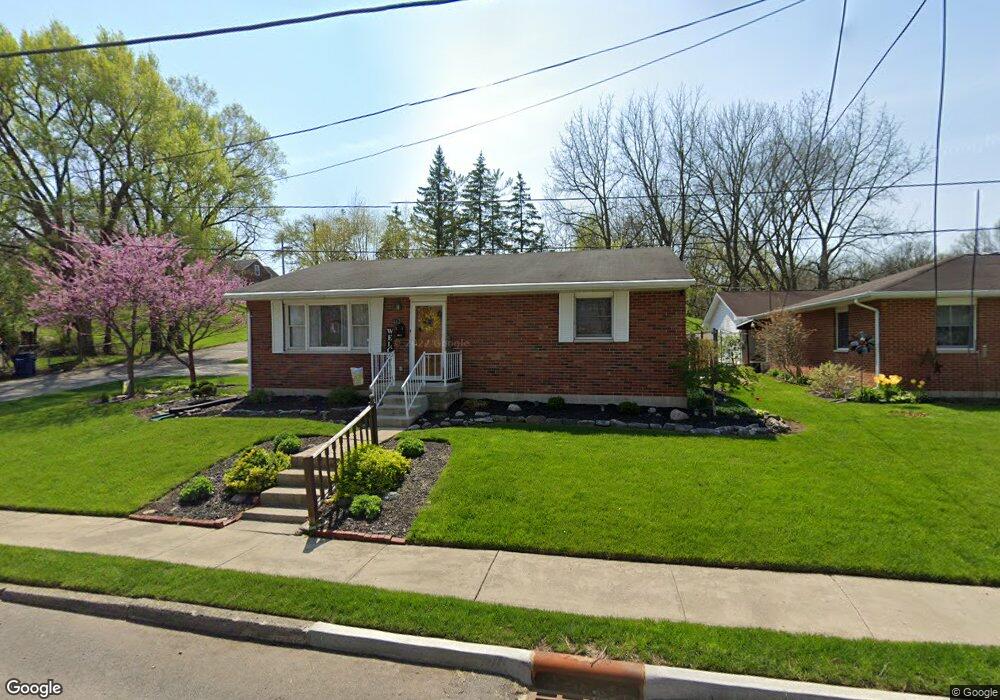
About This Home
This home is located at 442 Gordon St, Piqua, OH 45356 and is currently estimated at $139,530, approximately $123 per square foot. 442 Gordon St is a home located in Miami County with nearby schools including Piqua Junior High School, Piqua High School, and Nicholas School.
Ownership History
Date
Name
Owned For
Owner Type
Purchase Details
Closed on
Aug 9, 2018
Sold by
Hixson Trust
Bought by
Foster James D
Current Estimated Value
Home Financials for this Owner
Home Financials are based on the most recent Mortgage that was taken out on this home.
Original Mortgage
$71,632
Outstanding Balance
$61,688
Interest Rate
4.5%
Mortgage Type
FHA
Estimated Equity
$77,842
Purchase Details
Closed on
Jun 1, 2011
Sold by
Hixson Phyllis A
Bought by
Haney Pamela J and Phyllis A Hixson Irrevocable Trust Agree
Purchase Details
Closed on
Jan 19, 1989
Sold by
Haney Pamela J
Bought by
Hixson Phyllis
Create a Home Valuation Report for This Property
The Home Valuation Report is an in-depth analysis detailing your home's value as well as a comparison with similar homes in the area
Home Values in the Area
Average Home Value in this Area
Purchase History
| Date | Buyer | Sale Price | Title Company |
|---|---|---|---|
| Foster James D | $73,000 | Hallmark Title | |
| Haney Pamela J | -- | -- | |
| Hixson Phyllis | $41,500 | -- |
Source: Public Records
Mortgage History
| Date | Status | Borrower | Loan Amount |
|---|---|---|---|
| Open | Foster James D | $71,632 |
Source: Public Records
Tax History
| Year | Tax Paid | Tax Assessment Tax Assessment Total Assessment is a certain percentage of the fair market value that is determined by local assessors to be the total taxable value of land and additions on the property. | Land | Improvement |
|---|---|---|---|---|
| 2024 | $1,845 | $33,710 | $7,280 | $26,430 |
| 2023 | $1,385 | $33,710 | $7,280 | $26,430 |
| 2022 | $1,409 | $33,710 | $7,280 | $26,430 |
| 2021 | $1,141 | $24,960 | $5,390 | $19,570 |
| 2020 | $1,118 | $24,960 | $5,390 | $19,570 |
| 2019 | $1,124 | $24,960 | $5,390 | $19,570 |
| 2018 | $722 | $24,050 | $5,430 | $18,620 |
| 2017 | $731 | $24,050 | $5,430 | $18,620 |
| 2016 | $723 | $24,050 | $5,430 | $18,620 |
| 2015 | $695 | $23,140 | $5,220 | $17,920 |
| 2014 | $695 | $23,140 | $5,220 | $17,920 |
| 2013 | $698 | $23,140 | $5,220 | $17,920 |
Source: Public Records
Map
Nearby Homes
Your Personal Tour Guide
Ask me questions while you tour the home.