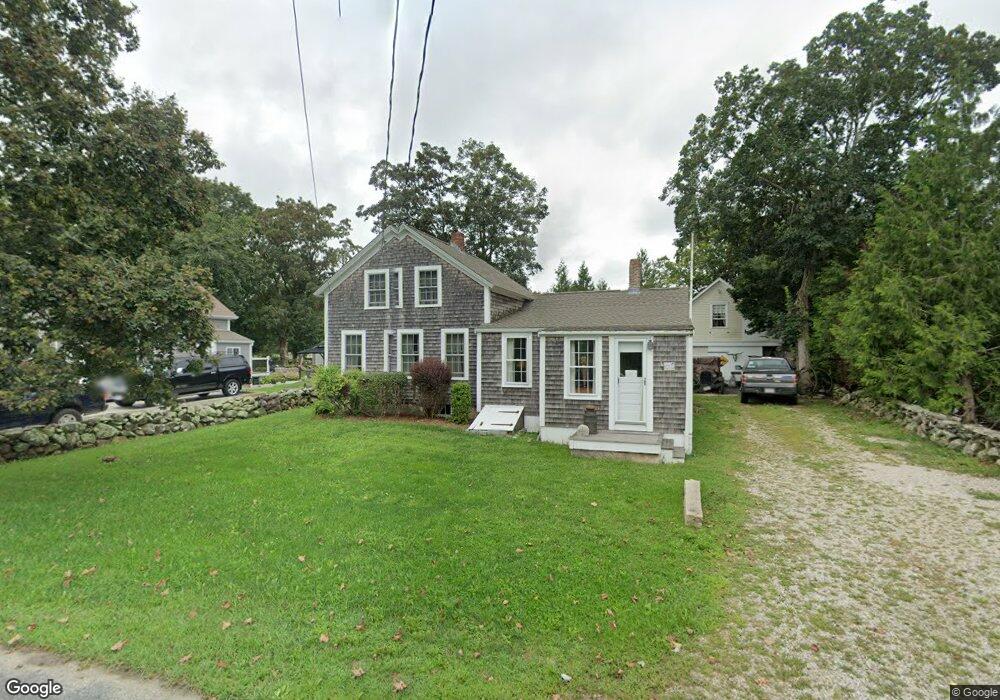
442 Hixbridge Rd Westport, MA 02790
Estimated Value: $473,000 - $775,000
2
Beds
1
Bath
1,284
Sq Ft
$447/Sq Ft
Est. Value
About This Home
This home is located at 442 Hixbridge Rd, Westport, MA 02790 and is currently estimated at $573,353, approximately $446 per square foot. 442 Hixbridge Rd is a home located in Bristol County with nearby schools including Alice A. Macomber Primary School, Westport Elementary School, and Westport Middle-High School.
Ownership History
Date
Name
Owned For
Owner Type
Purchase Details
Closed on
Aug 11, 2009
Sold by
Tripp Daniel Davis and Tripp Pamela Claire
Bought by
Davidson Stuart and Davidson Susan M
Current Estimated Value
Purchase Details
Closed on
May 11, 2005
Sold by
Tripp Daniel D and Tripp Pamela C
Bought by
Tripp Pamela C
Purchase Details
Closed on
Nov 25, 1992
Sold by
Macomber Karen E
Bought by
Tripp Daniel D and Tripp Pamela C
Create a Home Valuation Report for This Property
The Home Valuation Report is an in-depth analysis detailing your home's value as well as a comparison with similar homes in the area
Home Values in the Area
Average Home Value in this Area
Purchase History
| Date | Buyer | Sale Price | Title Company |
|---|---|---|---|
| Davidson Stuart | $284,000 | -- | |
| Tripp Pamela C | -- | -- | |
| Tripp Daniel D | $66,500 | -- |
Source: Public Records
Mortgage History
| Date | Status | Borrower | Loan Amount |
|---|---|---|---|
| Previous Owner | Tripp Daniel D | $50,000 | |
| Previous Owner | Tripp Daniel D | $215,000 | |
| Previous Owner | Tripp Daniel D | $50,000 |
Source: Public Records
Tax History Compared to Growth
Tax History
| Year | Tax Paid | Tax Assessment Tax Assessment Total Assessment is a certain percentage of the fair market value that is determined by local assessors to be the total taxable value of land and additions on the property. | Land | Improvement |
|---|---|---|---|---|
| 2025 | $2,642 | $354,600 | $179,500 | $175,100 |
| 2024 | $2,621 | $339,100 | $166,300 | $172,800 |
| 2023 | $2,441 | $299,100 | $140,100 | $159,000 |
| 2022 | $2,359 | $278,200 | $140,100 | $138,100 |
| 2021 | $5,539 | $265,500 | $127,400 | $138,100 |
| 2020 | $2,195 | $260,400 | $122,300 | $138,100 |
| 2019 | $2,046 | $247,400 | $116,900 | $130,500 |
| 2018 | $3,457 | $225,200 | $118,600 | $106,600 |
| 2017 | $1,794 | $225,100 | $120,800 | $104,300 |
| 2016 | $1,817 | $229,700 | $125,400 | $104,300 |
| 2015 | $1,725 | $217,500 | $127,700 | $89,800 |
Source: Public Records
Map
Nearby Homes
- 225 Hixbridge Rd
- 920 Drift Rd
- 73 White Oak Run
- 99 Sylvia Ln
- 2 Slades Farm Ln
- 837 Main Rd
- 8 Village Way
- 7 Village Way
- 15 Village Way
- 101 Adamsville Rd
- 118 Charlotte White Rd Extension
- 1346 Main Rd Unit B
- 0 Hidden Glen Ln
- 8 Strawberry Ln
- 1580 Main Rd
- 47 Fallon Dr
- Lot 0 Marcotte
- 1702J Drift Rd
- 1702 Drift Rd
- Lot 2E Horseneck Rd
- 438 Hixbridge Rd
- 434 Hix Bridge
- 434 Hixbridge Rd
- 450 Hixbridge Rd
- 458 Hixbridge Rd
- 426 Hixbridge Rd
- 0-7 Horseneck Rd
- Lot 3 Horseneck Rd
- Lot 00 Pine Hill Rd
- 00 Pine Hill Rd
- Lot 0 Hix Bridge Rd
- 47 Horseneck Rd
- 408 Hixbridge Rd
- 408 Hixbridge Rd Unit WINTER RENT
- 83 Horseneck Rd
- 417A Hixbridge Rd
- 407 Hixbridge Rd
- 473 Hixbridge Rd
- 494 Hixbridge Rd
- 878 Pine Hill Rd