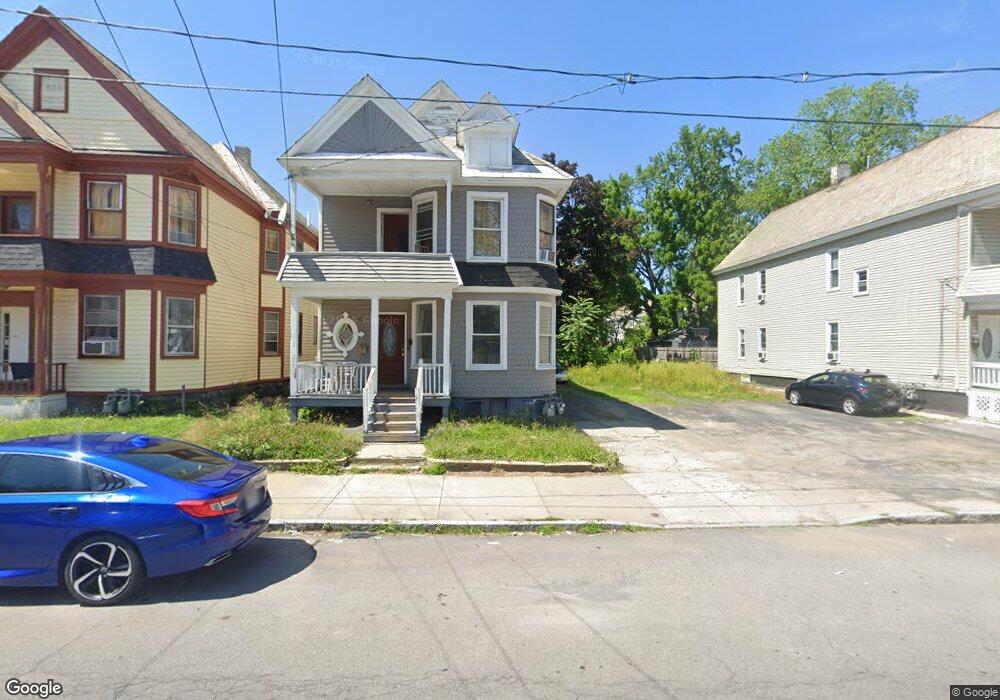
442 Hulett St Schenectady, NY 12307
Hamilton Hill NeighborhoodEstimated Value: $124,000 - $193,000
6
Beds
2
Baths
2,348
Sq Ft
$71/Sq Ft
Est. Value
About This Home
This home is located at 442 Hulett St, Schenectady, NY 12307 and is currently estimated at $167,713, approximately $71 per square foot. 442 Hulett St is a home located in Schenectady County with nearby schools including Pleasant Valley School, Mont Pleasant Middle School, and Schenectady High School.
Ownership History
Date
Name
Owned For
Owner Type
Purchase Details
Closed on
May 2, 2014
Sold by
Pashad Chad
Bought by
Moonsammy Kessoon and Moonsammy Chandra
Current Estimated Value
Purchase Details
Closed on
Aug 14, 2012
Sold by
Pashad Chad
Bought by
Pashad Chad
Purchase Details
Closed on
Jun 6, 2011
Sold by
Pashad Mohandranauth and Persaud Seeram
Bought by
Budhoo Nishan and Persaud Seeram
Purchase Details
Closed on
Apr 19, 2008
Sold by
Persaud Seeram
Bought by
Pashad Mohandrinauth
Purchase Details
Closed on
Nov 16, 2005
Purchase Details
Closed on
Jun 7, 2005
Sold by
Ramroop Scotty
Bought by
Pashad Mohandrinauth
Purchase Details
Closed on
May 16, 2003
Sold by
City Of Schenectady
Bought by
Ramroop Scotty
Purchase Details
Closed on
Feb 17, 2000
Purchase Details
Closed on
Jul 27, 1998
Sold by
Seeman Joseph
Bought by
Labynbard Eric and Labynbard Frances
Purchase Details
Closed on
Sep 4, 1996
Create a Home Valuation Report for This Property
The Home Valuation Report is an in-depth analysis detailing your home's value as well as a comparison with similar homes in the area
Home Values in the Area
Average Home Value in this Area
Purchase History
| Date | Buyer | Sale Price | Title Company |
|---|---|---|---|
| Moonsammy Kessoon | -- | None Available | |
| Pashad Chad | -- | None Available | |
| Budhoo Nishan | -- | None Available | |
| Pashad Mohandrinauth | -- | -- | |
| -- | -- | -- | |
| Pashad Mohandrinauth | $8,000 | -- | |
| Ramroop Scotty | $4,900 | -- | |
| -- | $20,582 | -- | |
| Labynbard Eric | $19,900 | -- | |
| -- | $6,500 | -- | |
| Labynbard Eric | -- | -- | |
| -- | $42,300 | -- |
Source: Public Records
Tax History Compared to Growth
Tax History
| Year | Tax Paid | Tax Assessment Tax Assessment Total Assessment is a certain percentage of the fair market value that is determined by local assessors to be the total taxable value of land and additions on the property. | Land | Improvement |
|---|---|---|---|---|
| 2024 | $4,480 | $65,100 | $9,800 | $55,300 |
| 2023 | $4,276 | $65,100 | $9,800 | $55,300 |
| 2022 | $4,108 | $65,100 | $9,800 | $55,300 |
| 2021 | $4,070 | $65,100 | $9,800 | $55,300 |
| 2020 | $3,989 | $65,100 | $9,800 | $55,300 |
| 2019 | $2,640 | $65,100 | $9,800 | $55,300 |
| 2018 | $4,021 | $65,100 | $9,800 | $55,300 |
| 2017 | $3,276 | $65,100 | $9,800 | $55,300 |
| 2016 | $4,093 | $65,100 | $9,800 | $55,300 |
| 2015 | -- | $65,100 | $9,800 | $55,300 |
| 2014 | -- | $65,100 | $9,800 | $55,300 |
Source: Public Records
Map
Nearby Homes