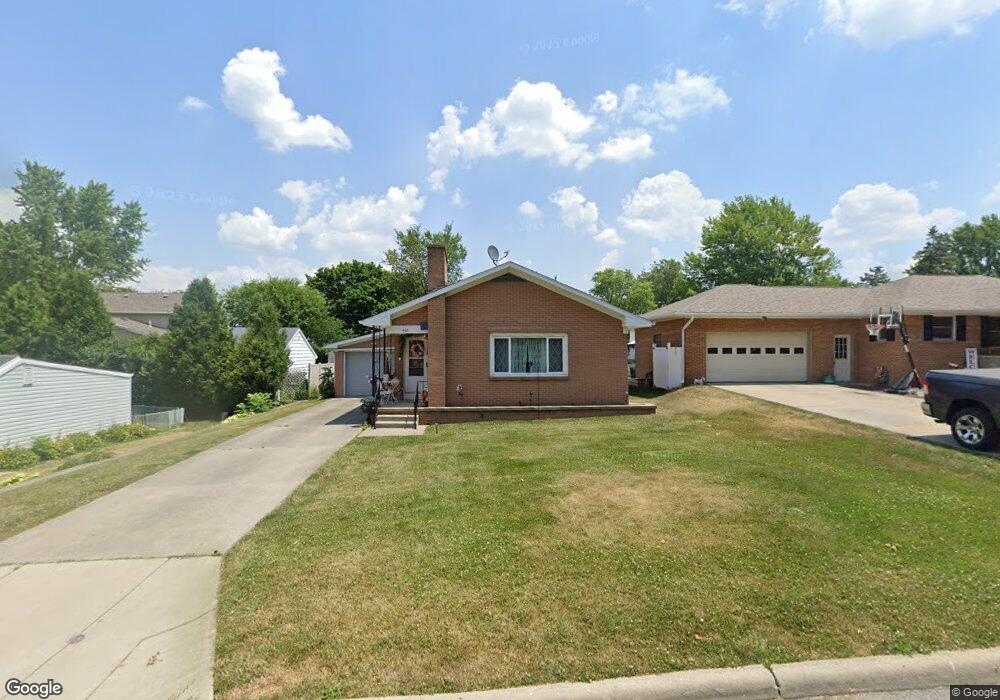
442 N Franklin St Wauseon, OH 43567
Estimated Value: $145,000 - $197,519
3
Beds
2
Baths
1,151
Sq Ft
$153/Sq Ft
Est. Value
About This Home
This home is located at 442 N Franklin St, Wauseon, OH 43567 and is currently estimated at $175,630, approximately $152 per square foot. 442 N Franklin St is a home located in Fulton County with nearby schools including Wauseon Primary School, Wauseon Elementary School, and Wauseon Middle School.
Ownership History
Date
Name
Owned For
Owner Type
Purchase Details
Closed on
Sep 16, 2019
Sold by
Stoner Ronald D and Estate Of Cathy Ann Dehass
Bought by
Kennedy Karen
Current Estimated Value
Home Financials for this Owner
Home Financials are based on the most recent Mortgage that was taken out on this home.
Original Mortgage
$102,000
Outstanding Balance
$89,344
Interest Rate
3.6%
Mortgage Type
VA
Estimated Equity
$86,286
Purchase Details
Closed on
Mar 24, 1997
Sold by
Est James A Gype
Bought by
Dehass Cathy A
Home Financials for this Owner
Home Financials are based on the most recent Mortgage that was taken out on this home.
Original Mortgage
$67,500
Interest Rate
7.82%
Mortgage Type
New Conventional
Purchase Details
Closed on
Jan 1, 1990
Bought by
Gype Loretta E -Le Gype
Create a Home Valuation Report for This Property
The Home Valuation Report is an in-depth analysis detailing your home's value as well as a comparison with similar homes in the area
Home Values in the Area
Average Home Value in this Area
Purchase History
| Date | Buyer | Sale Price | Title Company |
|---|---|---|---|
| Kennedy Karen | $102,000 | None Available | |
| Dehass Cathy A | $87,500 | -- | |
| Gype Loretta E -Le Gype | -- | -- |
Source: Public Records
Mortgage History
| Date | Status | Borrower | Loan Amount |
|---|---|---|---|
| Open | Kennedy Karen | $102,000 | |
| Previous Owner | Dehass Cathy A | $67,500 |
Source: Public Records
Tax History Compared to Growth
Tax History
| Year | Tax Paid | Tax Assessment Tax Assessment Total Assessment is a certain percentage of the fair market value that is determined by local assessors to be the total taxable value of land and additions on the property. | Land | Improvement |
|---|---|---|---|---|
| 2024 | $2,299 | $56,070 | $6,300 | $49,770 |
| 2023 | $2,299 | $56,070 | $6,300 | $49,770 |
| 2022 | $1,950 | $42,110 | $5,250 | $36,860 |
| 2021 | $2,070 | $42,110 | $5,250 | $36,860 |
| 2020 | $1,916 | $42,110 | $5,250 | $36,860 |
| 2019 | $2,396 | $41,130 | $5,250 | $35,880 |
| 2018 | $2,090 | $41,130 | $5,250 | $35,880 |
| 2017 | $2,062 | $41,130 | $5,250 | $35,880 |
| 2016 | $1,990 | $35,180 | $5,250 | $29,930 |
| 2015 | $1,865 | $35,180 | $5,250 | $29,930 |
| 2014 | $1,773 | $35,180 | $5,250 | $29,930 |
| 2013 | $2,206 | $40,470 | $4,730 | $35,740 |
Source: Public Records
Map
Nearby Homes
- 801 N Shoop Ave
- 527 E Elm St
- 623 E Elm St
- 227 Wabash St
- 236 Birch St
- 208 N Brunell St
- 00 Glenwood
- 0 Glenwood Unit 6124946
- 125 Cherry St
- 218 Cherry St
- 604 Cherry St
- 234 W Chestnut St
- 303 Eastwood St
- 263 W Chestnut St
- 115 W Leggett St
- 115 W Superior St
- 604 W Leggett St
- 420 Clover Ln
- 448 Dwight Ave
- 1235 N Ottokee St
- 434 N Franklin St
- 310 E Walnut St
- 304 E Walnut St
- 422 N Franklin St
- 437 Marshall St
- 449 Marshall St
- 429 Marshall St
- 435 N Franklin St
- 300 E Walnut St
- 425 Marshall St
- 418 N Franklin St
- 325 E Walnut St
- 331 E Walnut St
- 315 E Walnut St
- 421 Marshall St
- 421 N Franklin St
- 307 E Walnut St
- 335 E Walnut St
- 303 E Walnut St
- 415 Marshall St