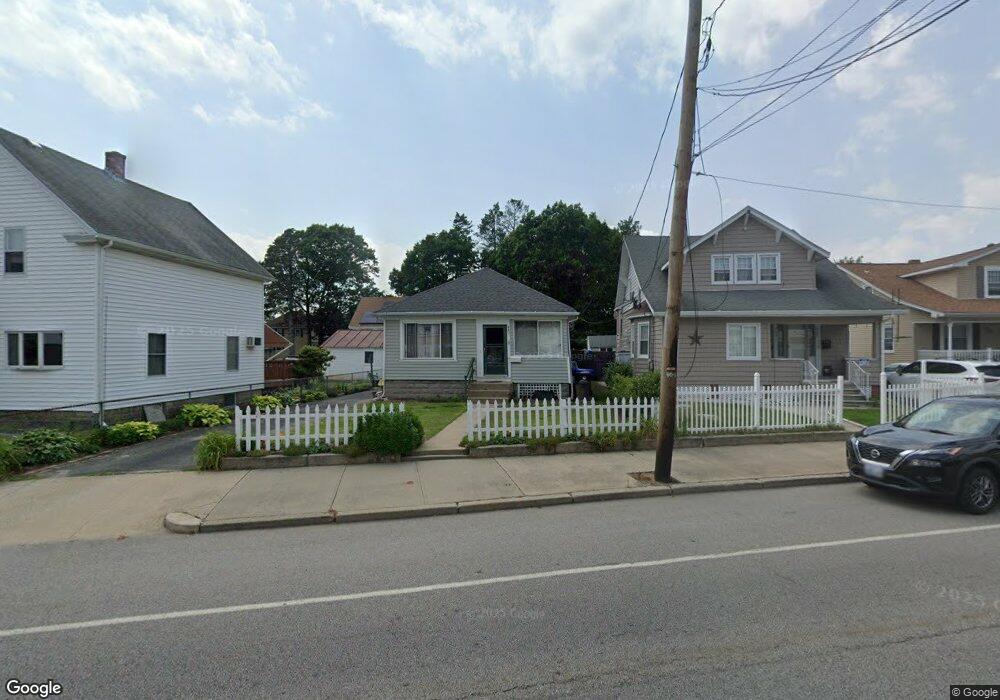
442 Power Rd Pawtucket, RI 02860
Fairlawn NeighborhoodEstimated Value: $315,063 - $366,000
2
Beds
1
Bath
792
Sq Ft
$433/Sq Ft
Est. Value
About This Home
This home is located at 442 Power Rd, Pawtucket, RI 02860 and is currently estimated at $343,016, approximately $433 per square foot. 442 Power Rd is a home located in Providence County with nearby schools including Blackstone Valley Prep Upper Elementary School, The San Miguel School, and Bishop Keough Regional High School.
Ownership History
Date
Name
Owned For
Owner Type
Purchase Details
Closed on
Oct 6, 2010
Sold by
Rose Richardo and Rose Renee M
Bought by
Rose Renee M
Current Estimated Value
Purchase Details
Closed on
Oct 31, 1988
Sold by
Pothier Denise
Bought by
Rose Ricardo
Create a Home Valuation Report for This Property
The Home Valuation Report is an in-depth analysis detailing your home's value as well as a comparison with similar homes in the area
Home Values in the Area
Average Home Value in this Area
Purchase History
| Date | Buyer | Sale Price | Title Company |
|---|---|---|---|
| Rose Renee M | -- | -- | |
| Rose Ricardo | $30,000 | -- |
Source: Public Records
Mortgage History
| Date | Status | Borrower | Loan Amount |
|---|---|---|---|
| Previous Owner | Rose Ricardo | $128,000 | |
| Previous Owner | Rose Ricardo | $240,000 | |
| Previous Owner | Rose Ricardo | $72,000 | |
| Previous Owner | Rose Ricardo | $72,500 |
Source: Public Records
Tax History
| Year | Tax Paid | Tax Assessment Tax Assessment Total Assessment is a certain percentage of the fair market value that is determined by local assessors to be the total taxable value of land and additions on the property. | Land | Improvement |
|---|---|---|---|---|
| 2025 | $3,256 | $247,600 | $122,800 | $124,800 |
| 2024 | $3,055 | $247,600 | $122,800 | $124,800 |
| 2023 | $2,971 | $175,400 | $74,100 | $101,300 |
| 2022 | $2,908 | $175,400 | $74,100 | $101,300 |
| 2021 | $2,908 | $175,400 | $74,100 | $101,300 |
| 2020 | $2,607 | $124,800 | $52,000 | $72,800 |
| 2019 | $2,607 | $124,800 | $52,000 | $72,800 |
| 2018 | $2,512 | $124,800 | $52,000 | $72,800 |
| 2017 | $2,722 | $119,800 | $55,300 | $64,500 |
| 2016 | $2,622 | $119,800 | $55,300 | $64,500 |
| 2015 | $2,622 | $119,800 | $55,300 | $64,500 |
| 2014 | $2,537 | $110,000 | $55,300 | $54,700 |
Source: Public Records
Map
Nearby Homes
- 2 Ward Ave
- 60 Dorman Ave
- 220 Francis Ave
- 60 Stedman Ave
- 53 Oriole Ave
- 458 Smithfield Ave
- 957 Mineral Spring Ave
- 63 Chandler Ave
- 53 Francis Ave
- 2 Cobble Hill Rd
- 11 Franklin St
- 121 Samuel Ave
- 18 Almy St
- 16 Rufus St
- 1190 Charles St Unit 20
- 1190 Charles St Unit 14
- 53 Samuel Ave
- 82 Hillcrest Ave
- 18 Fairmont Ave
- 8 Arnold Ave
Your Personal Tour Guide
Ask me questions while you tour the home.