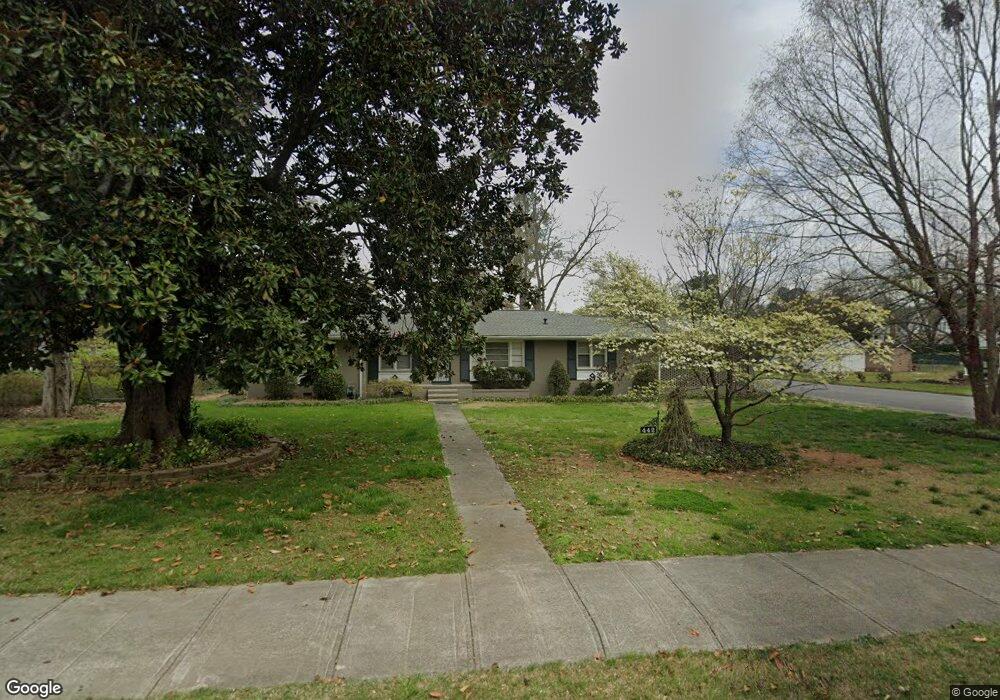
442 Wissahickon Ave Cedartown, GA 30125
Estimated Value: $296,000 - $352,000
4
Beds
3
Baths
2,574
Sq Ft
$123/Sq Ft
Est. Value
About This Home
This home is located at 442 Wissahickon Ave, Cedartown, GA 30125 and is currently estimated at $317,595, approximately $123 per square foot. 442 Wissahickon Ave is a home located in Polk County with nearby schools including Cedar Christian School and Vineyard Harvester Christian Academy.
Ownership History
Date
Name
Owned For
Owner Type
Purchase Details
Closed on
Nov 11, 2020
Sold by
Ironweed Llc
Bought by
Raybun Donna C
Current Estimated Value
Purchase Details
Closed on
Sep 19, 2017
Sold by
Raybun Donna C
Bought by
Ironweed Llc
Purchase Details
Closed on
Aug 2, 1993
Sold by
Falkenstein Kurt A
Bought by
Raybun Walter A
Purchase Details
Closed on
Sep 12, 1990
Sold by
Holder George
Bought by
Falkenstein Kirt A
Purchase Details
Closed on
Dec 21, 1989
Sold by
Welsh James and Welsh Linda
Bought by
Holder George
Purchase Details
Closed on
Sep 20, 1986
Sold by
Cummings Vernon G
Bought by
Walsh James D
Purchase Details
Closed on
Dec 31, 1976
Sold by
Cummings F Marion
Bought by
Cummings Vernon G
Purchase Details
Closed on
Aug 16, 1969
Sold by
Raymond R J
Bought by
Cunnings F Marion
Purchase Details
Closed on
Jan 15, 1966
Sold by
Yrle Robert C
Bought by
Raymond R J
Purchase Details
Closed on
Mar 30, 1959
Bought by
Yrle Robert C
Create a Home Valuation Report for This Property
The Home Valuation Report is an in-depth analysis detailing your home's value as well as a comparison with similar homes in the area
Home Values in the Area
Average Home Value in this Area
Purchase History
| Date | Buyer | Sale Price | Title Company |
|---|---|---|---|
| Raybun Donna C | -- | -- | |
| Ironweed Llc | -- | -- | |
| Raybun Walter A | $95,000 | -- | |
| Falkenstein Kirt A | $85,000 | -- | |
| Holder George | $44,000 | -- | |
| Walsh James D | -- | -- | |
| Cummings Vernon G | -- | -- | |
| Cunnings F Marion | -- | -- | |
| Raymond R J | -- | -- | |
| Yrle Robert C | -- | -- |
Source: Public Records
Tax History Compared to Growth
Tax History
| Year | Tax Paid | Tax Assessment Tax Assessment Total Assessment is a certain percentage of the fair market value that is determined by local assessors to be the total taxable value of land and additions on the property. | Land | Improvement |
|---|---|---|---|---|
| 2024 | $4,379 | $138,638 | $4,760 | $133,878 |
| 2023 | $2,697 | $77,799 | $2,720 | $75,079 |
| 2022 | $1,605 | $67,610 | $2,720 | $64,890 |
| 2021 | $1,625 | $67,610 | $2,720 | $64,890 |
| 2020 | $1,629 | $67,610 | $2,720 | $64,890 |
| 2019 | $1,595 | $59,390 | $2,352 | $57,038 |
| 2018 | $1,596 | $57,927 | $2,352 | $55,575 |
| 2017 | $1,522 | $57,927 | $2,352 | $55,575 |
| 2016 | $1,217 | $46,718 | $2,352 | $44,366 |
| 2015 | $1,228 | $46,999 | $2,352 | $44,647 |
| 2014 | $1,237 | $46,999 | $2,352 | $44,647 |
Source: Public Records
Map
Nearby Homes
- 421 Wissahickon Ave
- 305 N Cave Spring St
- 258 Chestnut St
- 309 Walnut St
- 214 Victoria Ave
- 328 Mountain Home Rd
- 601 Mountain Home Rd
- 605 W Girard Ave
- 144 Marshall St
- 422 Walnut St
- 408 N College St
- 228 Marshall St
- 443 N Cave Spring St
- 208 Highland Ave
- 607 N College St
- 119 Jackson St
- 328 330 Stubbs
- 293 4th St
- 382 5th St
- 217 E Gibson St
- 446 Wissahickon Ave
- 426 Wissahickon Ave
- 433 Wissahickon Ave
- 424 Wissahickon Ave
- 117 Chestnut St
- 431 Wissahickon Ave
- 445 Wissahickon Ave
- 456 Wissahickon Ave
- 429 Wissahickon Ave
- 422 Wissahickon Ave
- 455 Wissahickon Ave
- 121 Chestnut St
- 124 Walnut St
- 451 Wissahickon Ave
- 417 Wissahickon Ave
- 103 Walnut St
- 111 Walnut St
- 459 Wissahickon Ave
- 117 N Cave Spring St
- 124 Chestnut St