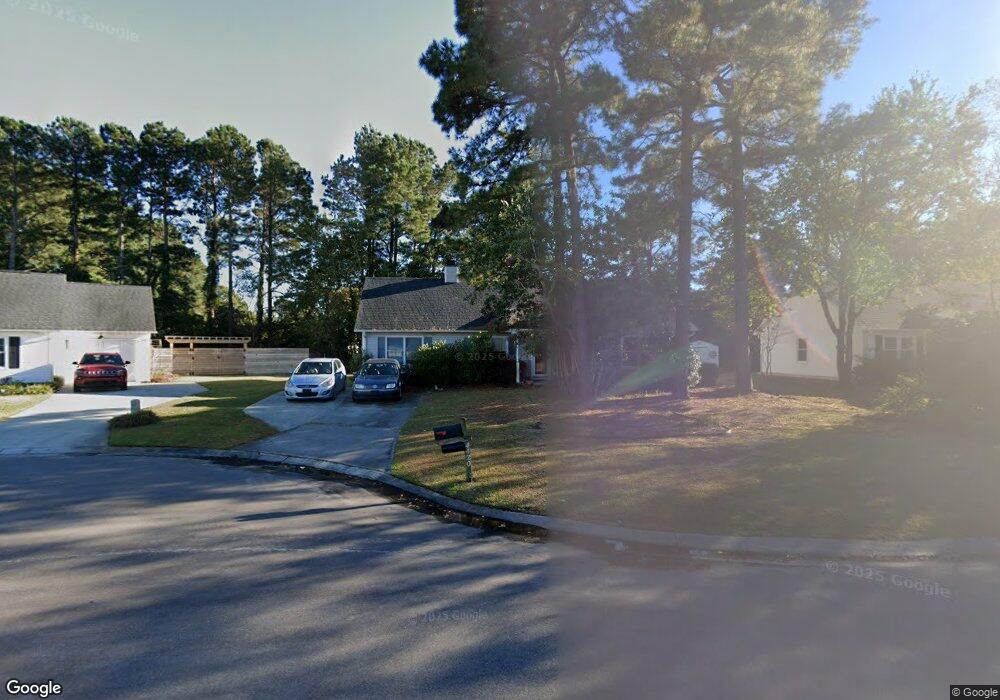
4420 Bridgeport Dr Wilmington, NC 28405
Estimated Value: $308,000 - $330,000
3
Beds
2
Baths
1,296
Sq Ft
$245/Sq Ft
Est. Value
About This Home
This home is located at 4420 Bridgeport Dr, Wilmington, NC 28405 and is currently estimated at $317,100, approximately $244 per square foot. 4420 Bridgeport Dr is a home located in New Hanover County with nearby schools including Castle Hayne Elementary School, Emma B. Trask Middle School, and Emsley A. Laney High School.
Ownership History
Date
Name
Owned For
Owner Type
Purchase Details
Closed on
Jan 31, 2008
Sold by
Wellman Christopher and Church Jennifer Kay
Bought by
Brown Julie Fisher
Current Estimated Value
Home Financials for this Owner
Home Financials are based on the most recent Mortgage that was taken out on this home.
Original Mortgage
$131,200
Outstanding Balance
$82,643
Interest Rate
6.12%
Mortgage Type
Purchase Money Mortgage
Estimated Equity
$234,457
Purchase Details
Closed on
Jun 27, 2003
Sold by
Moore Charlotte Williams
Bought by
Wellman Christopher Jennifer
Purchase Details
Closed on
Mar 3, 1992
Sold by
Ammons Northchase Corp
Bought by
Moore Charlotte Williams
Purchase Details
Closed on
Aug 1, 1988
Sold by
Ammons Northchase Corp
Bought by
Ammons Northchase Corp
Purchase Details
Closed on
Mar 1, 1987
Sold by
Ammons-Boykin Corporation
Bought by
Ammons Northchase Corp
Create a Home Valuation Report for This Property
The Home Valuation Report is an in-depth analysis detailing your home's value as well as a comparison with similar homes in the area
Home Values in the Area
Average Home Value in this Area
Purchase History
| Date | Buyer | Sale Price | Title Company |
|---|---|---|---|
| Brown Julie Fisher | $168,000 | None Available | |
| Wellman Christopher Jennifer | $107,000 | -- | |
| Moore Charlotte Williams | $14,000 | -- | |
| Ammons Northchase Corp | -- | -- | |
| Ammons Northchase Corp | -- | -- |
Source: Public Records
Mortgage History
| Date | Status | Borrower | Loan Amount |
|---|---|---|---|
| Open | Brown Julie Fisher | $131,200 |
Source: Public Records
Tax History Compared to Growth
Tax History
| Year | Tax Paid | Tax Assessment Tax Assessment Total Assessment is a certain percentage of the fair market value that is determined by local assessors to be the total taxable value of land and additions on the property. | Land | Improvement |
|---|---|---|---|---|
| 2025 | $1,241 | $314,400 | $113,000 | $201,400 |
| 2023 | $1,068 | $194,600 | $62,400 | $132,200 |
| 2022 | $1,073 | $194,600 | $62,400 | $132,200 |
| 2021 | $1,074 | $194,600 | $62,400 | $132,200 |
| 2020 | $858 | $135,700 | $34,000 | $101,700 |
| 2019 | $858 | $135,700 | $34,000 | $101,700 |
| 2018 | $858 | $135,700 | $34,000 | $101,700 |
| 2017 | $879 | $135,700 | $34,000 | $101,700 |
| 2016 | $833 | $120,200 | $34,000 | $86,200 |
| 2015 | $774 | $120,200 | $34,000 | $86,200 |
| 2014 | $761 | $120,200 | $34,000 | $86,200 |
Source: Public Records
Map
Nearby Homes
- 4424 Bridgeport Dr
- 4409 Woodcroft Ct
- 3206 Monticello Dr
- 4013 Claymore Dr
- 4300 Pennhurst Ct
- 3337 Brucemont Dr
- 4305 Vicar Ct
- 2608 Hargate Ct
- 3628 Calabash Ct
- 2035 N Kerr Ave
- 2509 N Kerr Ave
- 4814 Exton Park Loop
- 5103 Exton Park Loop
- 1221 Saint Augustine Dr
- 1933 N Kerr Ave
- 4574 Parsons Mill Dr
- 4612 Parsons Mill Dr
- 4624 Parsons Mill Dr
- Lot 184 Murrayville Rd
- 6105 Northshore Dr
- 4418 Bridgeport Dr
- 4422 Bridgeport Dr
- 3030 Weatherby Ct
- 3032 Weatherby Ct
- 4416 Bridgeport Dr
- 4417 Bridgeport Dr
- 3028 Weatherby Ct
- 3034 Weatherby Ct
- 4421 Bridgeport Dr
- 3026 Weatherby Ct
- 4415 Bridgeport Dr
- 4414 Bridgeport Dr
- 4416 Woodcroft Ct
- 3036 Weatherby Ct
- 4416 Woodcroft Dr
- 4414 Woodcroft Ct
- 4414 Woodcroft Dr
- 4418 Woodcroft Dr
- 4413 Bridgeport Dr
- 3025 Weatherby Ct