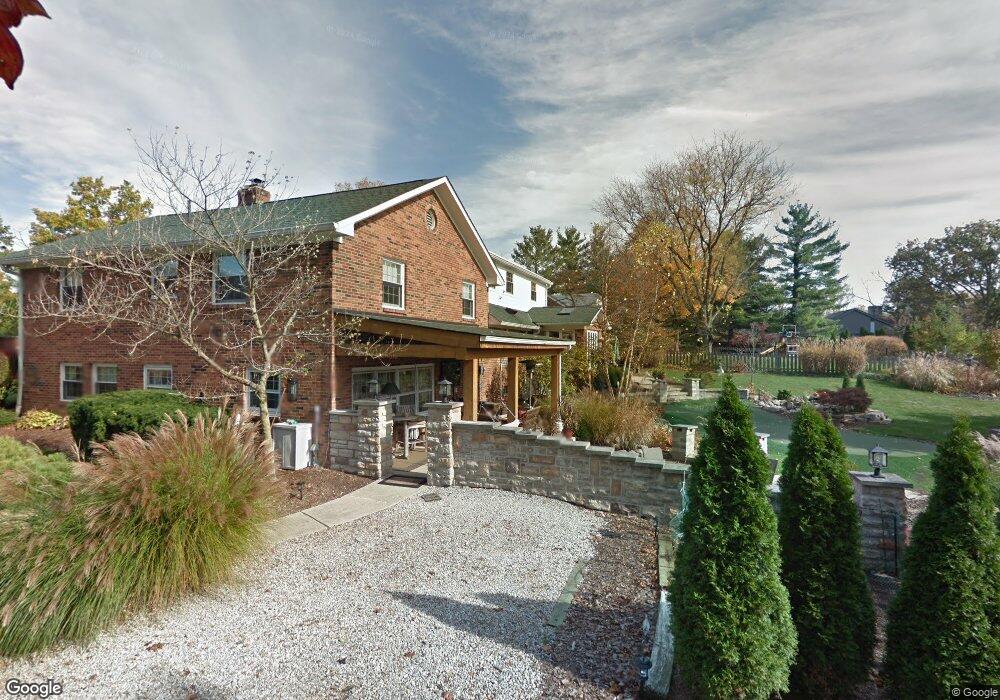
4420 Kipling Ln Columbus, OH 43220
Estimated Value: $866,000 - $1,073,986
5
Beds
4
Baths
2,637
Sq Ft
$371/Sq Ft
Est. Value
About This Home
This home is located at 4420 Kipling Ln, Columbus, OH 43220 and is currently estimated at $977,662, approximately $370 per square foot. 4420 Kipling Ln is a home located in Franklin County with nearby schools including Windermere Elementary School, Hastings Middle School, and Upper Arlington High School.
Ownership History
Date
Name
Owned For
Owner Type
Purchase Details
Closed on
May 30, 2017
Sold by
Wick George P and Wick Sarah T
Bought by
Erb Thomas and Erb Jennifer L
Current Estimated Value
Home Financials for this Owner
Home Financials are based on the most recent Mortgage that was taken out on this home.
Original Mortgage
$124,100
Outstanding Balance
$102,228
Interest Rate
4.02%
Mortgage Type
New Conventional
Estimated Equity
$875,434
Purchase Details
Closed on
Feb 3, 1997
Sold by
Thompson Richard T
Bought by
Wick George P and Wick Sarah T
Home Financials for this Owner
Home Financials are based on the most recent Mortgage that was taken out on this home.
Original Mortgage
$272,800
Interest Rate
7.81%
Mortgage Type
New Conventional
Create a Home Valuation Report for This Property
The Home Valuation Report is an in-depth analysis detailing your home's value as well as a comparison with similar homes in the area
Home Values in the Area
Average Home Value in this Area
Purchase History
| Date | Buyer | Sale Price | Title Company |
|---|---|---|---|
| Erb Thomas | $720,000 | Northwest Title | |
| Wick George P | $341,000 | -- |
Source: Public Records
Mortgage History
| Date | Status | Borrower | Loan Amount |
|---|---|---|---|
| Open | Erb Thomas | $124,100 | |
| Previous Owner | Wick George P | $272,800 |
Source: Public Records
Tax History
| Year | Tax Paid | Tax Assessment Tax Assessment Total Assessment is a certain percentage of the fair market value that is determined by local assessors to be the total taxable value of land and additions on the property. | Land | Improvement |
|---|---|---|---|---|
| 2025 | $16,154 | $279,030 | $93,840 | $185,190 |
| 2024 | $16,154 | $279,030 | $93,840 | $185,190 |
| 2023 | $15,954 | $279,020 | $93,835 | $185,185 |
| 2022 | $18,468 | $264,290 | $74,830 | $189,460 |
| 2021 | $16,348 | $264,290 | $74,830 | $189,460 |
| 2020 | $16,203 | $264,290 | $74,830 | $189,460 |
| 2019 | $14,846 | $214,100 | $74,830 | $139,270 |
| 2018 | $13,803 | $214,100 | $74,830 | $139,270 |
| 2017 | $13,706 | $214,100 | $74,830 | $139,270 |
| 2016 | $12,680 | $191,770 | $53,590 | $138,180 |
| 2015 | $12,669 | $191,770 | $53,590 | $138,180 |
| 2014 | $12,683 | $191,770 | $53,590 | $138,180 |
| 2013 | $6,264 | $180,320 | $48,720 | $131,600 |
Source: Public Records
Map
Nearby Homes
- 2626 Chartwell Rd
- 2533 Middlesex Rd
- 2200 Nayland Rd
- 2242 Atlee Ct Unit 5
- 2158 Sandston Rd
- 3900 Hillview Dr
- 4219 Bibury Ct
- 3055 Carriage Ln
- 5000 Slate Run Woods Ct
- 4325 Cameron Rd
- 4025 Dublin Rd
- 2668 Edgevale Rd
- 2458 Edgevale Rd
- 4260 Darbyshire Ct
- 5233 Brandy Oaks Ln Unit 5233
- 1916 Willoway Cir S
- 2413 Edgevale Rd
- 1883 Willoway Cir N Unit 1883
- 1594 Lafayette Dr Unit 1594
- 5273 Brandy Oaks Ln
- 4420 Kipling Rd
- 2531 Wimbledon Rd
- 4441 Kipling Rd
- 4421 Kipling Rd
- 4400 Kipling Rd
- 2534 Wimbledon Rd
- 4455 Kipling Rd
- 2520 Wimbledon Rd
- 2525 Wimbledon Rd
- 4401 Kipling Rd
- 4401 Kipling Ln
- 2508 Wimbledon Rd
- 2533 Haverford Rd
- 4469 Kipling Rd
- 2591 Haverford Rd
- 4362 Shelbourne Ln
- 2521 Haverford Rd
- 2575 Haverford Rd
- 2626 Alliston Ct
- 2496 Wimbledon Rd
Your Personal Tour Guide
Ask me questions while you tour the home.