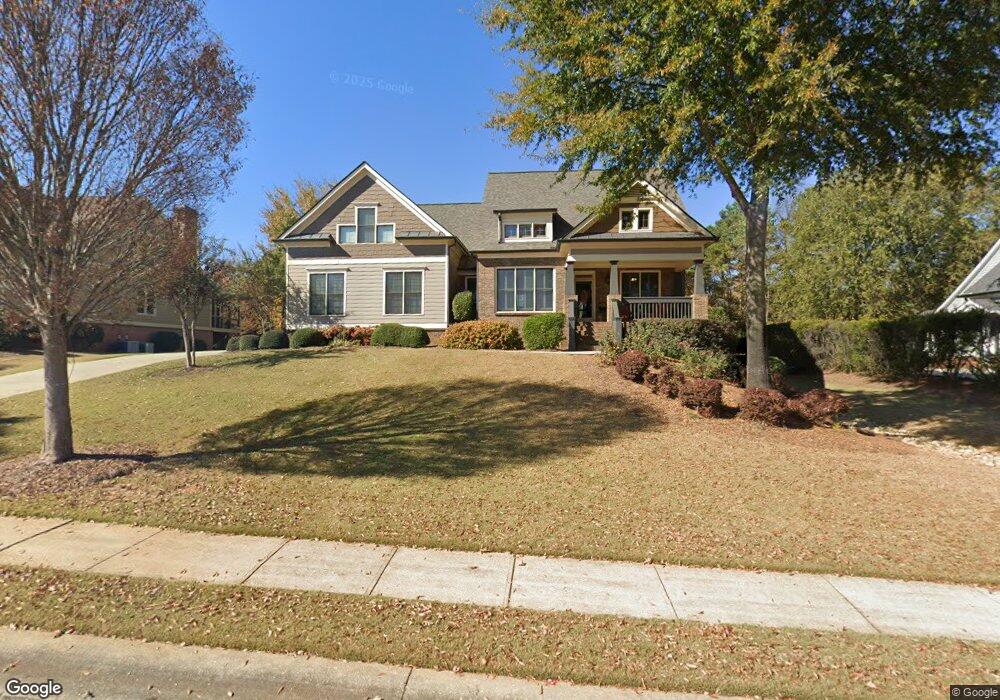
4420 Longmead Rd Flowery Branch, GA 30542
Royal Lakes NeighborhoodEstimated Value: $670,000 - $853,000
5
Beds
4
Baths
2,858
Sq Ft
$258/Sq Ft
Est. Value
About This Home
This home is located at 4420 Longmead Rd, Flowery Branch, GA 30542 and is currently estimated at $738,350, approximately $258 per square foot. 4420 Longmead Rd is a home located in Hall County with nearby schools including Chicopee Elementary School, South Hall Middle School, and Johnson High School.
Ownership History
Date
Name
Owned For
Owner Type
Purchase Details
Closed on
May 31, 2007
Sold by
Relo Direct Inc
Bought by
Parker Jeffrey and Parker Angela
Current Estimated Value
Home Financials for this Owner
Home Financials are based on the most recent Mortgage that was taken out on this home.
Original Mortgage
$75,000
Outstanding Balance
$45,048
Interest Rate
6.12%
Mortgage Type
New Conventional
Estimated Equity
$693,302
Purchase Details
Closed on
Apr 25, 2005
Sold by
Gary & Olsson Properties Llc
Bought by
Ciezadlo Gregory J and Ciezadlo Kate
Home Financials for this Owner
Home Financials are based on the most recent Mortgage that was taken out on this home.
Original Mortgage
$335,622
Interest Rate
5.88%
Mortgage Type
New Conventional
Purchase Details
Closed on
Feb 26, 2004
Sold by
Blue Water Development
Bought by
Gary & Olsson Properties Llc
Purchase Details
Closed on
Apr 11, 1995
Sold by
Gmb Ltd D B A Dale Gross Const
Bought by
Lanier Natl Bnk
Create a Home Valuation Report for This Property
The Home Valuation Report is an in-depth analysis detailing your home's value as well as a comparison with similar homes in the area
Home Values in the Area
Average Home Value in this Area
Purchase History
| Date | Buyer | Sale Price | Title Company |
|---|---|---|---|
| Parker Jeffrey | $500,000 | -- | |
| Relo Direct Inc | $600,000 | -- | |
| Ciezadlo Gregory J | $450,700 | -- | |
| Gary & Olsson Properties Llc | $223,500 | -- | |
| Lanier Natl Bnk | $169,600 | -- |
Source: Public Records
Mortgage History
| Date | Status | Borrower | Loan Amount |
|---|---|---|---|
| Open | Relo Direct Inc | $75,000 | |
| Open | Relo Direct Inc | $400,000 | |
| Previous Owner | Ciezadlo Gregory J | $335,622 |
Source: Public Records
Tax History Compared to Growth
Tax History
| Year | Tax Paid | Tax Assessment Tax Assessment Total Assessment is a certain percentage of the fair market value that is determined by local assessors to be the total taxable value of land and additions on the property. | Land | Improvement |
|---|---|---|---|---|
| 2025 | $5,490 | $265,520 | $35,920 | $229,600 |
| 2024 | $5,611 | $223,080 | $30,800 | $192,280 |
| 2023 | $5,313 | $226,480 | $28,240 | $198,240 |
| 2022 | $5,422 | $206,520 | $30,800 | $175,720 |
| 2021 | $4,871 | $181,680 | $23,600 | $158,080 |
| 2020 | $4,857 | $176,000 | $23,600 | $152,400 |
| 2019 | $4,593 | $193,840 | $19,640 | $174,200 |
| 2018 | $4,512 | $156,635 | $31,200 | $125,435 |
| 2017 | $4,322 | $151,555 | $36,520 | $115,035 |
| 2016 | $4,219 | $151,555 | $36,520 | $115,035 |
| 2015 | $3,690 | $151,555 | $36,520 | $115,035 |
| 2014 | $3,690 | $162,275 | $36,520 | $125,755 |
Source: Public Records
Map
Nearby Homes
- 4439 Oxburgh Park
- 4434 Oxburgh Park
- 4315 Marble Arch Way
- 4478 Longmead Rd
- 0 Marble Arch Way
- 4610 Blakeford Ct
- 4621 Chartwell Chase Ct
- 4835 Upper Berkshire Rd
- 4708 Upper Berkshire Rd Unit 39
- 4135 Ashford Way
- 4211 Quail Creek Dr
- 3927 Celtic Ct
- 3969 Bolding Rd
- 4234 Quail Creek Dr
- 4226 Quail Creek Dr
- 3929 Perry Ln
- 4743 Amsterdam Ln
- 0 Longmead Rd Unit 8630143
- 0 Longmead Rd Unit 8117848
- 0 Longmead Rd Unit 3147317
- 4335 Sloan Mill Rd
- 4416 Longmead Rd
- 4428 Longmead Rd
- 4412 Longmead Rd
- 4409 Oxburgh Park
- 4419 Longmead Rd
- 4405 Oxburgh Park
- 4427 Longmead Rd
- 4423 Longmead Rd
- 4413 Oxburgh Park
- 4432 Longmead Rd
- 4408 Longmead Rd
- 4431 Longmead Rd
- 4448 Sandhurst Place
- 4444 Sandhurst Place
- 4417 Oxburgh Park
- 4415 Longmead Rd