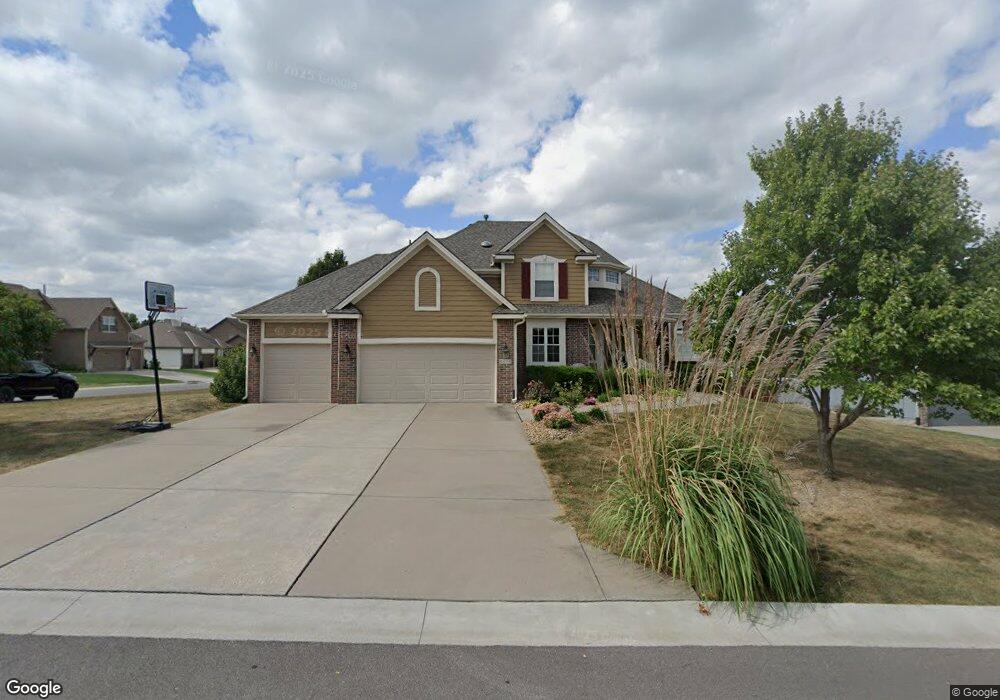
4420 SW Lyndsie Ct Lees Summit, MO 64082
Estimated Value: $474,000 - $514,000
About This Home
This home is located at 4420 SW Lyndsie Ct, Lees Summit, MO 64082 and is currently estimated at $500,209, approximately $208 per square foot. 4420 SW Lyndsie Ct is a home located in Jackson County with nearby schools including Summit Pointe Elementary School, Summit Lakes Middle School, and Lee's Summit West High School.
Ownership History
We collect this data history from publicly available records. To have your information removed, we recommend requesting removal directly through your county’s website.
Purchase Details
Home Financials for this Owner
Home Financials are based on the most recent Mortgage that was taken out on this home.Purchase Details
Purchase Details
Home Financials for this Owner
Home Financials are based on the most recent Mortgage that was taken out on this home.Purchase Details
Home Financials for this Owner
Home Financials are based on the most recent Mortgage that was taken out on this home.Home Values in the Area
Average Home Value in this Area
Purchase History
We collect this data history from publicly available records. To have your information removed, we recommend requesting removal directly through your county’s website.
| Date | Buyer | Sale Price | Title Company |
|---|---|---|---|
| -- | None Available | ||
| $180,667 | None Available | ||
| -- | Coffelt Land Title Inc | ||
| -- | Coffelt Land Title Inc |
Mortgage History
We collect this data history from publicly available records. To have your information removed, we recommend requesting removal directly through your county’s website.
| Date | Status | Borrower | Loan Amount |
|---|---|---|---|
| Open | $161,600 | ||
| Previous Owner | $284,488 | ||
| Previous Owner | $234,165 |
Tax History
We collect this data history from publicly available records. To have your information removed, we recommend requesting removal directly through your county’s website.
| Year | Tax Paid | Tax Assessment Tax Assessment Total Assessment is a certain percentage of the fair market value that is determined by local assessors to be the total taxable value of land and additions on the property. | Land | Improvement |
|---|---|---|---|---|
| 2025 | $5,405 | $75,634 | $16,310 | $59,324 |
| 2024 | $5,366 | $74,860 | $15,394 | $59,466 |
| 2023 | $5,366 | $74,860 | $15,394 | $59,466 |
| 2022 | $4,617 | $57,190 | $6,732 | $50,458 |
| 2021 | $4,712 | $57,190 | $6,732 | $50,458 |
| 2020 | $4,528 | $54,420 | $6,732 | $47,688 |
| 2019 | $4,820 | $59,551 | $6,732 | $52,819 |
| 2018 | $1,682,220 | $51,828 | $5,859 | $45,969 |
| 2017 | $4,520 | $51,828 | $5,859 | $45,969 |
| 2016 | $3,971 | $45,068 | $6,099 | $38,969 |
| 2014 | $4,124 | $45,885 | $6,517 | $39,368 |
Map
- 1273 SW Nagona Ln
- 1425 SW 44th St
- 1121 SW Cheshire Dr
- 1200 SW Cornwall Rd
- 1505 SW Georgetown Dr
- 1517 SW Georgetown Dr
- 1412 SW Whistle Dr
- 4421 SW Hillside Dr
- 4524 SW Berkshire Dr
- 1513 SW Whistle Dr
- 1404 SW 41st Cir
- 1021 SW Drake Cir
- 1912 SW Merryman Dr
- 1540 SW Cornwall Rd
- 4628 SW Robinson Dr
- 4212 SW Stoney Brook Dr
- 1717 SW Hightown Dr
- 3940 SW Flintrock Dr
- 3932 SW Flintrock Dr
- 3949 SW Flintrock Dr
- 4416 SW Lyndsie Ct
- 4412 SW Lyndsie Ct
- 4408 SW Lyndsie Ct
- 4421 SW Flintrock Dr
- 4417 SW Flintrock Dr
- 4417 SW Lyndsie Ct
- 1308 SW Merryman Dr
- 1324 SW Merryman Dr
- 4413 SW Lyndsie Ct
- 1317 SW Merryman Dr
- 4404 SW Lyndsie Ct
- 4409 SW Lyndsie Ct
- 1309 SW Merryman Dr
- 1401 SW 44th St
- 1313 SW Merryman Dr
- 1321 SW Merryman Dr
- 1328 SW Merryman Dr
- 1304 SW Merryman Dr
- 1325 SW Merryman Dr
- 4409 SW Flintrock Dr
Ask me questions while you tour the home.