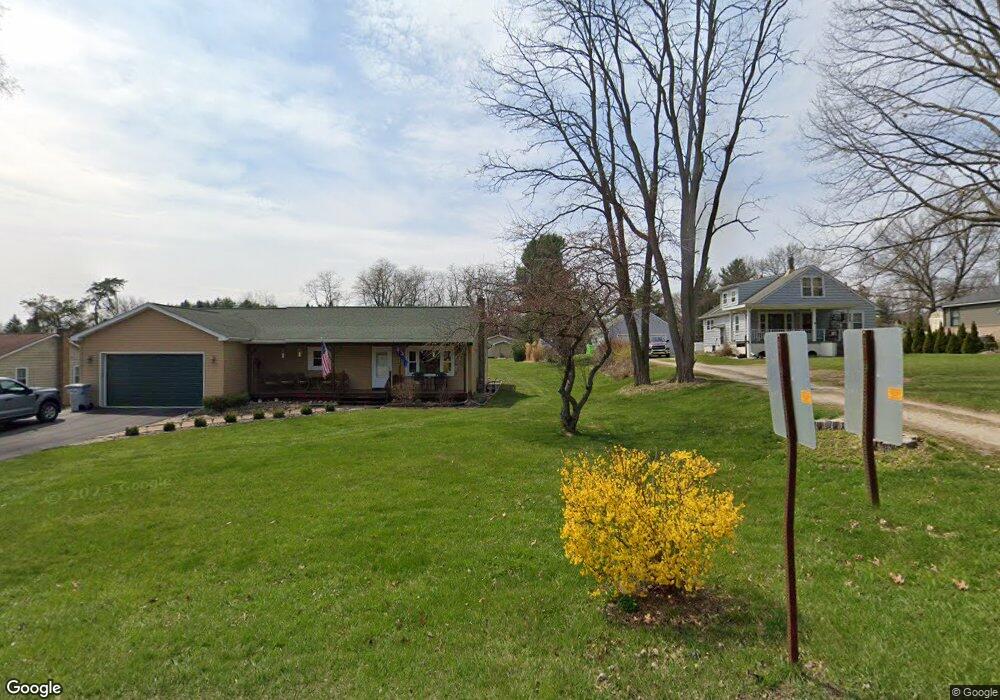
4420 van Amberg Rd Unit Bldg-Unit Brighton, MI 48114
Estimated Value: $340,000 - $437,000
3
Beds
2
Baths
1,548
Sq Ft
$251/Sq Ft
Est. Value
About This Home
This home is located at 4420 van Amberg Rd Unit Bldg-Unit, Brighton, MI 48114 and is currently estimated at $388,243, approximately $250 per square foot. 4420 van Amberg Rd Unit Bldg-Unit is a home located in Livingston County with nearby schools including Spencer Road Elementary School, Scranton Middle School, and Brighton High School.
Ownership History
Date
Name
Owned For
Owner Type
Purchase Details
Closed on
Feb 15, 2018
Sold by
Leahy Mark and Leahy Alice L
Bought by
Pieknik David L and Allison Evan M
Current Estimated Value
Purchase Details
Closed on
May 16, 2014
Sold by
Fannie Mae
Bought by
Leahy Mark and Leahy Alice L
Home Financials for this Owner
Home Financials are based on the most recent Mortgage that was taken out on this home.
Original Mortgage
$91,100
Interest Rate
4.28%
Mortgage Type
Purchase Money Mortgage
Purchase Details
Closed on
Feb 20, 2013
Sold by
Cusumano John and Cusumano Karen
Bought by
Federal National Mortgage Association
Purchase Details
Closed on
Oct 11, 1995
Sold by
Gladys King Est
Bought by
John and Cusumano Karen
Home Financials for this Owner
Home Financials are based on the most recent Mortgage that was taken out on this home.
Original Mortgage
$76,000
Interest Rate
7.44%
Mortgage Type
New Conventional
Create a Home Valuation Report for This Property
The Home Valuation Report is an in-depth analysis detailing your home's value as well as a comparison with similar homes in the area
Home Values in the Area
Average Home Value in this Area
Purchase History
| Date | Buyer | Sale Price | Title Company |
|---|---|---|---|
| Pieknik David L | $235,000 | -- | |
| Leahy Mark | $95,900 | -- | |
| Federal National Mortgage Association | $69,398 | -- | |
| John | $80,000 | -- |
Source: Public Records
Mortgage History
| Date | Status | Borrower | Loan Amount |
|---|---|---|---|
| Previous Owner | Leahy Mark | $91,100 | |
| Previous Owner | John | $76,000 |
Source: Public Records
Tax History
| Year | Tax Paid | Tax Assessment Tax Assessment Total Assessment is a certain percentage of the fair market value that is determined by local assessors to be the total taxable value of land and additions on the property. | Land | Improvement |
|---|---|---|---|---|
| 2025 | $1,879 | $177,600 | $0 | $0 |
| 2024 | $1,826 | $167,800 | $0 | $0 |
| 2023 | $1,792 | $151,000 | $0 | $0 |
| 2022 | $3,012 | $119,200 | $0 | $0 |
| 2021 | $3,012 | $134,900 | $0 | $0 |
| 2020 | $2,999 | $125,200 | $0 | $0 |
| 2019 | $2,955 | $119,200 | $0 | $0 |
| 2018 | $2,011 | $97,300 | $0 | $0 |
| 2017 | $1,886 | $97,300 | $0 | $0 |
| 2016 | $1,875 | $84,800 | $0 | $0 |
| 2014 | $1,092 | $47,860 | $0 | $0 |
| 2012 | $1,092 | $51,020 | $0 | $0 |
Source: Public Records
Map
Nearby Homes
- 4570 River Hills Ct
- 4610 van Amberg Rd
- VL Herbst
- 3728 Christopher Dr
- 5388 Daniel Dr
- 11021 Culver Rd
- 0000 Valencia
- 10384 Overhill Dr
- 4253 Link Dr
- 3137 Sandpoint Dr
- 3170 Skyview Ct
- 3616 Bay Harbor Dr
- 11245 Guyn Dr
- 11306 Woodruff Lake Dr
- 5061 Walsh Dr
- 5946 Alan Dr Unit 47
- 5946 Alan Dr Unit 40
- 5955 Alan Dr Unit 61
- 5959 Alan Dr Unit 52
- 5959 Alan Dr Unit 56
- 4420 van Amberg Rd
- 4410 van Amberg Rd
- LOT 7 Spruce Pointe
- 4430 van Amberg Rd
- LOT 6 Spruce Pointe
- 4394 van Amberg Rd
- 4450 van Amberg Rd
- 4415 van Amberg Rd
- 4455 van Amberg Rd
- VACANT LOT van Amberg Rd
- VACANT LOT #3 van Amberg Rd
- 10961 Spencer Rd
- 4425 Brian Dr
- 4471 van Amberg Rd
- 10973 Spencer Rd
- 4421 Andersen Dr
- 4411 Andersen Dr
- 4431 Andersen Dr
- 10951 Spencer Rd
- 4401 Andersen Dr
Your Personal Tour Guide
Ask me questions while you tour the home.