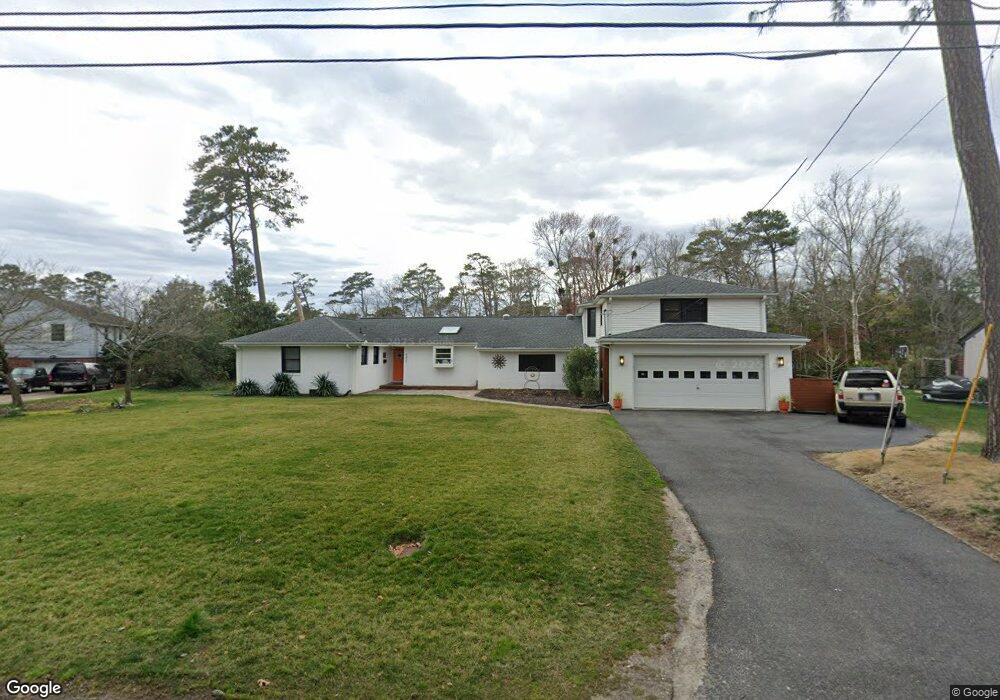
4421 Blackbeard Rd Virginia Beach, VA 23455
Bayville NeighborhoodEstimated Value: $1,119,000 - $1,283,000
6
Beds
4
Baths
4,301
Sq Ft
$279/Sq Ft
Est. Value
About This Home
This home is located at 4421 Blackbeard Rd, Virginia Beach, VA 23455 and is currently estimated at $1,200,150, approximately $279 per square foot. 4421 Blackbeard Rd is a home located in Virginia Beach City with nearby schools including Thoroughgood Elementary School, Great Neck Middle School, and Frank W. Cox High School.
Ownership History
Date
Name
Owned For
Owner Type
Purchase Details
Closed on
Jul 9, 2018
Sold by
Looney William P and Looney Morgan K
Bought by
Murray Christopher J and Murray Leah K
Current Estimated Value
Home Financials for this Owner
Home Financials are based on the most recent Mortgage that was taken out on this home.
Original Mortgage
$575,725
Outstanding Balance
$500,055
Interest Rate
4.6%
Mortgage Type
VA
Estimated Equity
$700,095
Purchase Details
Closed on
Jan 27, 2012
Sold by
Wood Carolyn H
Bought by
Looney Morgan K
Home Financials for this Owner
Home Financials are based on the most recent Mortgage that was taken out on this home.
Original Mortgage
$508,100
Interest Rate
3.94%
Mortgage Type
VA
Purchase Details
Closed on
Oct 23, 2000
Sold by
Smith John M
Bought by
Wood Thomas H
Home Financials for this Owner
Home Financials are based on the most recent Mortgage that was taken out on this home.
Original Mortgage
$235,000
Interest Rate
7.83%
Create a Home Valuation Report for This Property
The Home Valuation Report is an in-depth analysis detailing your home's value as well as a comparison with similar homes in the area
Home Values in the Area
Average Home Value in this Area
Purchase History
| Date | Buyer | Sale Price | Title Company |
|---|---|---|---|
| Murray Christopher J | $641,350 | Attorney | |
| Looney Morgan K | $528,500 | -- | |
| Wood Thomas H | $335,000 | -- |
Source: Public Records
Mortgage History
| Date | Status | Borrower | Loan Amount |
|---|---|---|---|
| Open | Murray Christopher J | $575,725 | |
| Previous Owner | Looney Morgan K | $508,100 | |
| Previous Owner | Wood Thomas H | $235,000 |
Source: Public Records
Tax History Compared to Growth
Tax History
| Year | Tax Paid | Tax Assessment Tax Assessment Total Assessment is a certain percentage of the fair market value that is determined by local assessors to be the total taxable value of land and additions on the property. | Land | Improvement |
|---|---|---|---|---|
| 2025 | $9,370 | $960,400 | $510,000 | $450,400 |
| 2024 | $9,370 | $966,000 | $510,000 | $456,000 |
| 2023 | $8,882 | $897,200 | $475,000 | $422,200 |
| 2022 | $7,444 | $751,900 | $350,000 | $401,900 |
| 2021 | $6,700 | $676,800 | $288,400 | $388,400 |
| 2020 | $6,734 | $661,800 | $288,400 | $373,400 |
| 2019 | $6,200 | $608,400 | $288,400 | $320,000 |
| 2018 | $6,099 | $608,400 | $288,400 | $320,000 |
| 2017 | $5,954 | $593,900 | $288,400 | $305,500 |
| 2016 | $5,880 | $593,900 | $280,000 | $313,900 |
| 2015 | $5,352 | $540,600 | $280,000 | $260,600 |
| 2014 | $4,860 | $536,900 | $282,800 | $254,100 |
Source: Public Records
Map
Nearby Homes
- 4604 Islander Ct
- 4491 Lauderdale Ave
- 4484 Lauderdale Ave
- 2424 Tranquility Ln
- 4479 Ocean View Ave
- 4617 Lookout Rd
- 4736 Hollis Rd
- 4823 Secure Ct
- 4645 Guam St
- 4815 Lake Dr Unit A
- 4603 Ocean View Ave
- 2305 Purple Martin Ln
- 4802 Bay Landing Dr
- 2505 Bridgeside Place
- 4818 Lee Ave
- 2509 Bridge Side Place
- 4840 Bay Landing Dr
- 4716 Hook Ln
- 4064 Timber Ridge Dr
- 2367 Madison Ave Unit X4034
- 4425 Blackbeard Rd
- 4417 Blackbeard Rd
- 4416 Blackbeard Rd
- 4413 Blackbeard Rd
- 4429 Blackbeard Rd
- 4432 Blackbeard Rd
- 4404 Blackbeard Rd
- 4409 Blackbeard Rd
- 4433 Blackbeard Rd
- 4436 Blackbeard Rd
- 4405 Blackbeard Rd
- 2305 Trelawney Rd
- 4437 Blackbeard Rd
- 4400 Blackbeard Rd
- 2309 Trelawney Rd
- 4401 Blackbeard Rd
- 4440 Blackbeard Rd
- 4441 Blackbeard Rd
- 2313 Trelawney Rd
- 4337 Blackbeard Rd