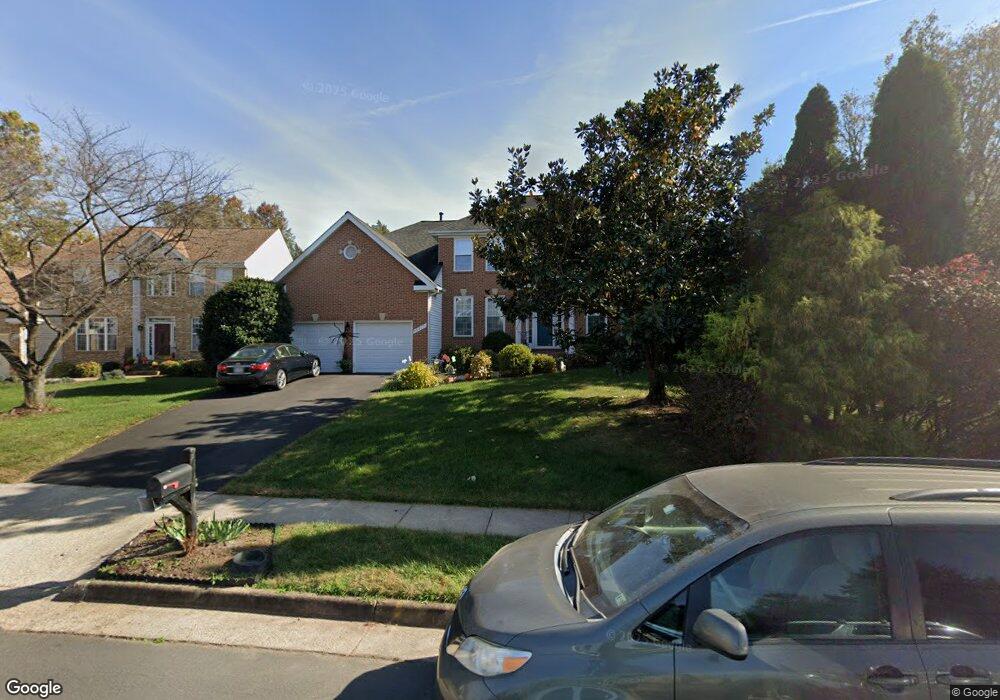
44215 Palladian Ct Ashburn, VA 20147
Estimated Value: $946,000 - $1,017,000
4
Beds
4
Baths
2,698
Sq Ft
$364/Sq Ft
Est. Value
About This Home
This home is located at 44215 Palladian Ct, Ashburn, VA 20147 and is currently estimated at $982,564, approximately $364 per square foot. 44215 Palladian Ct is a home located in Loudoun County with nearby schools including Discovery Elementary School, Farmwell Station Middle School, and Broad Run High School.
Ownership History
Date
Name
Owned For
Owner Type
Purchase Details
Closed on
Aug 21, 2025
Sold by
Berger Michael and Berger Brooks A
Bought by
Michael Berger Living Trust and Brooks Billingsley Berger Living Trust
Current Estimated Value
Purchase Details
Closed on
Feb 26, 1999
Sold by
Remen Arthur A
Bought by
Jensen Robert W
Home Financials for this Owner
Home Financials are based on the most recent Mortgage that was taken out on this home.
Original Mortgage
$225,000
Interest Rate
6.78%
Purchase Details
Closed on
Jun 19, 1995
Sold by
Stanley Martin North Lp
Bought by
Remen Arthur A
Home Financials for this Owner
Home Financials are based on the most recent Mortgage that was taken out on this home.
Original Mortgage
$202,000
Interest Rate
8.24%
Create a Home Valuation Report for This Property
The Home Valuation Report is an in-depth analysis detailing your home's value as well as a comparison with similar homes in the area
Home Values in the Area
Average Home Value in this Area
Purchase History
| Date | Buyer | Sale Price | Title Company |
|---|---|---|---|
| Michael Berger Living Trust | -- | None Listed On Document | |
| Jensen Robert W | $285,000 | -- | |
| Remen Arthur A | $267,500 | -- |
Source: Public Records
Mortgage History
| Date | Status | Borrower | Loan Amount |
|---|---|---|---|
| Previous Owner | Jensen Robert W | $225,000 | |
| Previous Owner | Remen Arthur A | $202,000 |
Source: Public Records
Tax History Compared to Growth
Tax History
| Year | Tax Paid | Tax Assessment Tax Assessment Total Assessment is a certain percentage of the fair market value that is determined by local assessors to be the total taxable value of land and additions on the property. | Land | Improvement |
|---|---|---|---|---|
| 2025 | $7,229 | $898,000 | $299,300 | $598,700 |
| 2024 | $7,268 | $840,230 | $294,300 | $545,930 |
| 2023 | $7,080 | $809,130 | $294,300 | $514,830 |
| 2022 | $6,767 | $760,370 | $269,300 | $491,070 |
| 2021 | $6,544 | $667,790 | $219,300 | $448,490 |
| 2020 | $6,500 | $627,990 | $197,900 | $430,090 |
| 2019 | $6,443 | $616,590 | $197,900 | $418,690 |
| 2018 | $6,098 | $561,990 | $177,900 | $384,090 |
| 2017 | $6,172 | $548,590 | $177,900 | $370,690 |
| 2016 | $6,333 | $553,060 | $0 | $0 |
| 2015 | $6,308 | $377,880 | $0 | $377,880 |
| 2014 | $6,253 | $363,470 | $0 | $363,470 |
Source: Public Records
Map
Nearby Homes
- 21081 Bitterroot Terrace
- 44289 Suscon Square
- 21292 Victorias Cross Terrace
- 44248 Suscon Square
- 20961 Cohasset Terrace
- 44383 Agawam Terrace
- 21376 Clappertown Dr
- 44465 Chamberlain Terrace Unit 103
- 44485 Chamberlain Terrace Unit 200
- 21250 Dubois Ct
- 21031 Lemon Springs Terrace
- 43877 Sandburg Square
- 43949 Bruceton Mills Cir
- 20861 Killawog Terrace
- 44424 Livonia Terrace
- 21480 Trowbridge Square
- 43800 Stonebridge Dr
- 44557 Granite Run Terrace
- 43793 Steinbeck Square
- 43866 Laburnum Square
- 44219 Palladian Ct
- 21297 Cameron Hunt Place
- 44223 Palladian Ct
- 21248 Rosetta Place
- 21293 Cameron Hunt Place
- 44218 Palladian Ct
- 21244 Rosetta Place
- 44227 Palladian Ct
- 21252 Rosetta Place
- 44222 Palladian Ct
- 21301 Cameron Hunt Place
- 21240 Rosetta Place
- 21256 Rosetta Place
- 21249 Rosetta Place
- 21245 Rosetta Place
- 21305 Cameron Hunt Place
- 21253 Rosetta Place
- 21236 Rosetta Place
- 21260 Rosetta Place
- 21237 Rosetta Place