Estimated Value: $445,000 - $459,000
3
Beds
3
Baths
2,398
Sq Ft
$188/Sq Ft
Est. Value
About This Home
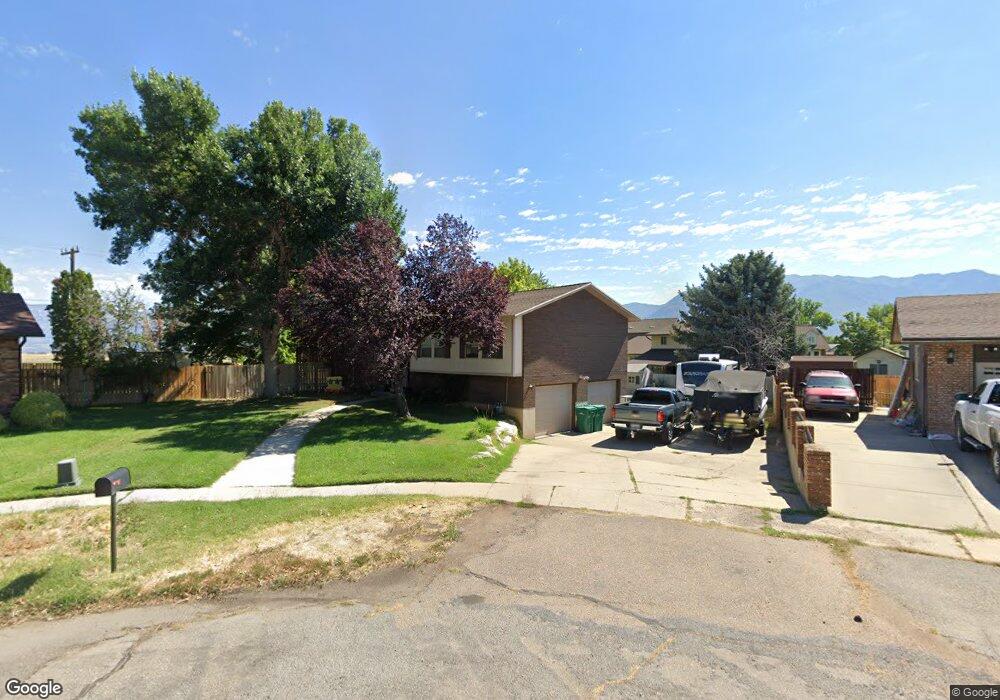
This home is located at 4422 S 1675 W, Roy, UT 84067 and is currently estimated at $450,137, approximately $187 per square foot. 4422 S 1675 W is a home located in Weber County with nearby schools including Valley View School, Sand Ridge Junior High School, and Roy High School.
Ownership History
Date
Name
Owned For
Owner Type
Purchase Details
Closed on
Nov 27, 2019
Sold by
Flaherty Christina M and Griffin Walton D
Bought by
Vandeput Theophile
Current Estimated Value
Home Financials for this Owner
Home Financials are based on the most recent Mortgage that was taken out on this home.
Original Mortgage
$255,290
Outstanding Balance
$226,118
Interest Rate
4.37%
Mortgage Type
FHA
Estimated Equity
$224,019
Purchase Details
Closed on
Mar 2, 2017
Sold by
Lauenstein Patricia and Lauenstein Edward
Bought by
Flaherty Christina M and Griffin Walton D
Home Financials for this Owner
Home Financials are based on the most recent Mortgage that was taken out on this home.
Original Mortgage
$155,700
Interest Rate
4.09%
Mortgage Type
New Conventional
Purchase Details
Closed on
Sep 22, 2003
Sold by
Elliott Michele A
Bought by
Elliott Michele A and The Michele A Elliott Family Protection
Create a Home Valuation Report for This Property
The Home Valuation Report is an in-depth analysis detailing your home's value as well as a comparison with similar homes in the area
Home Values in the Area
Average Home Value in this Area
Purchase History
| Date | Buyer | Sale Price | Title Company |
|---|---|---|---|
| Vandeput Theophile | -- | Vanguard Title Ins Agcy | |
| Flaherty Christina M | -- | Stewart Title Ins Agency | |
| Elliott Michele A | -- | -- |
Source: Public Records
Mortgage History
| Date | Status | Borrower | Loan Amount |
|---|---|---|---|
| Open | Vandeput Theophile | $255,290 | |
| Previous Owner | Flaherty Christina M | $155,700 |
Source: Public Records
Tax History
| Year | Tax Paid | Tax Assessment Tax Assessment Total Assessment is a certain percentage of the fair market value that is determined by local assessors to be the total taxable value of land and additions on the property. | Land | Improvement |
|---|---|---|---|---|
| 2025 | $2,812 | $446,962 | $160,903 | $286,059 |
| 2024 | $2,749 | $241,999 | $88,504 | $153,495 |
| 2023 | $2,662 | $234,851 | $84,805 | $150,046 |
| 2022 | $2,537 | $228,801 | $67,942 | $160,859 |
| 2021 | $2,193 | $326,000 | $87,613 | $238,387 |
| 2020 | $2,019 | $275,000 | $87,613 | $187,387 |
| 2019 | $2,027 | $261,000 | $52,047 | $208,953 |
| 2018 | $1,923 | $233,000 | $47,059 | $185,941 |
| 2017 | $1,870 | $213,000 | $47,059 | $165,941 |
| 2016 | $1,702 | $103,539 | $25,392 | $78,147 |
| 2015 | $1,651 | $103,315 | $22,645 | $80,670 |
| 2014 | $1,665 | $103,315 | $22,645 | $80,670 |
Source: Public Records
Map
Nearby Homes
- 4593 Promenade Dr Unit 16
- 4539 S 1800 W Unit 127
- 4536 S 1900 W Unit 12
- 4602 Hathaway Dr
- 4642 S 1900 W Unit 41
- 2015 W 4225 S
- 2038 W 4600 S
- 4220 S 2075 W
- 4533 S 2075 W
- 1783 W 5000 S
- 1789 W 5000 S
- 4328 S 2175 W
- 5006 S 1800 W
- 1765 W 5000 S
- 1959 3985 St S Unit 2
- 1838 W 5050 S
- 1114 W 4650 S
- 1829 W 5050 S
- 1910 W 3920 S
- 1789 W 5050 S