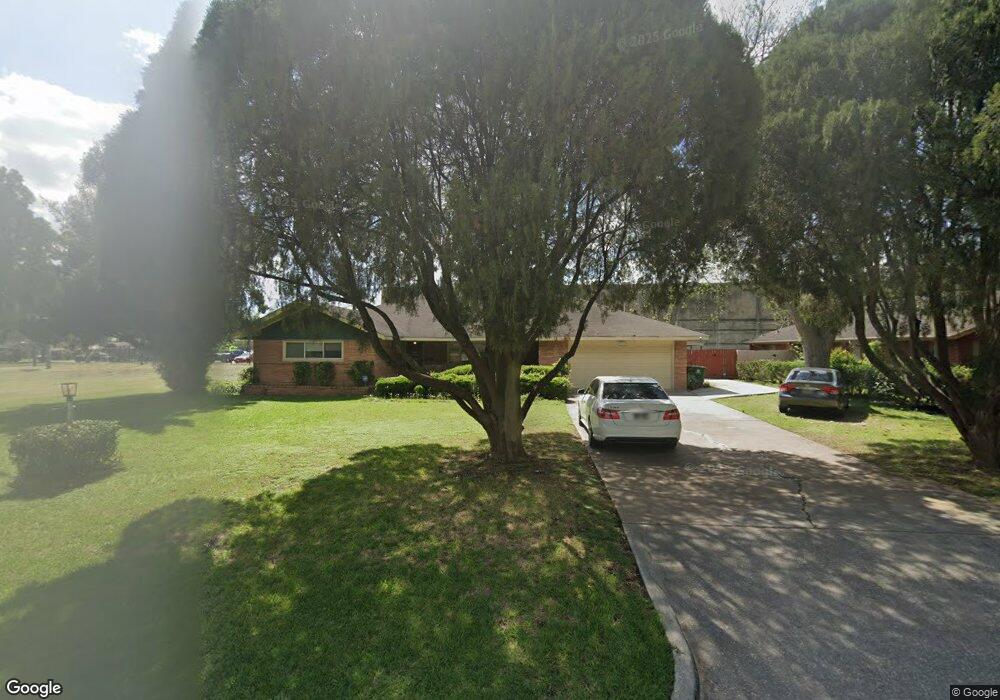
4423 Busiek St Houston, TX 77022
Independence Heights NeighborhoodEstimated Value: $339,000 - $431,000
3
Beds
2
Baths
2,271
Sq Ft
$166/Sq Ft
Est. Value
About This Home
This home is located at 4423 Busiek St, Houston, TX 77022 and is currently estimated at $376,688, approximately $165 per square foot. 4423 Busiek St is a home located in Harris County with nearby schools including Kennedy Elementary School, Williams Middle, and Booker T Washington Sr High.
Ownership History
Date
Name
Owned For
Owner Type
Purchase Details
Closed on
Feb 15, 2024
Sold by
Brown Douglas Cheryl and Brown Cheryl Tims
Bought by
Tims Cheryl and Tims Randy Earl
Current Estimated Value
Purchase Details
Closed on
Oct 2, 2002
Sold by
Douglas Rodney K and Douglas Rodney Keith
Bought by
Douglas Cheryl L and Douglas Cheryl Lynn
Create a Home Valuation Report for This Property
The Home Valuation Report is an in-depth analysis detailing your home's value as well as a comparison with similar homes in the area
Home Values in the Area
Average Home Value in this Area
Purchase History
| Date | Buyer | Sale Price | Title Company |
|---|---|---|---|
| Tims Cheryl | -- | None Listed On Document | |
| Douglas Cheryl L | -- | -- |
Source: Public Records
Mortgage History
| Date | Status | Borrower | Loan Amount |
|---|---|---|---|
| Closed | Douglas Cheryl L | $0 |
Source: Public Records
Tax History Compared to Growth
Tax History
| Year | Tax Paid | Tax Assessment Tax Assessment Total Assessment is a certain percentage of the fair market value that is determined by local assessors to be the total taxable value of land and additions on the property. | Land | Improvement |
|---|---|---|---|---|
| 2025 | $4,479 | $401,900 | $275,265 | $126,635 |
| 2024 | $4,479 | $365,448 | $275,265 | $90,183 |
| 2023 | $4,479 | $353,223 | $244,680 | $108,543 |
| 2022 | $5,803 | $324,000 | $244,680 | $79,320 |
| 2021 | $5,584 | $298,788 | $193,705 | $105,083 |
| 2020 | $5,274 | $271,612 | $183,510 | $88,102 |
| 2019 | $5,010 | $217,726 | $91,755 | $125,971 |
| 2018 | $3,360 | $180,000 | $91,755 | $88,245 |
| 2017 | $4,323 | $182,147 | $61,170 | $120,977 |
| 2016 | $3,930 | $155,411 | $40,780 | $114,631 |
| 2015 | $2,489 | $153,645 | $40,780 | $112,865 |
| 2014 | $2,489 | $129,064 | $28,036 | $101,028 |
Source: Public Records
Map
Nearby Homes
- 4303 Cadmus St
- 4440 Castor St
- 4305 Castor St
- 600 E Whitney St
- 4303 Castor Na St
- 4303 Castor St
- 4309 Delhi St
- 502 W Crosstimbers St
- 821 Barkley St
- 4206 Oxford St
- 821 Neyland St
- 4302 Delhi St
- 4311 Europa St
- 603 Neyland
- 4208 Castor St Unit B
- 4208 Castor St Unit A
- 4220 Delhi St
- 435 Neyland St
- 508 Neyland St
- 431 Neyland St
- 4417 Busiek St
- 4431 Busiek St
- 4419 Busiek St
- 4435 Busiek St
- 703 Crosstimbers St
- 1 Crosstimbers St
- 2 Crosstimbers St
- 5 Crosstimbers St
- 4439 Busiek St
- 4424 Busiek St
- 4426 Busiek St
- 9 Crosstimbers St
- 4430 Busiek St
- 4434 Busiek St
- 4443 Busiek St
- 4323 Busiek St
- 4322 Cadmus St
- 4438 Busiek St
- 612 E Whitney St
- 4322 Busiek St