4425 16th St NW Canton, OH 44708
Estimated Value: $184,000 - $219,000
3
Beds
1
Bath
1,130
Sq Ft
$179/Sq Ft
Est. Value
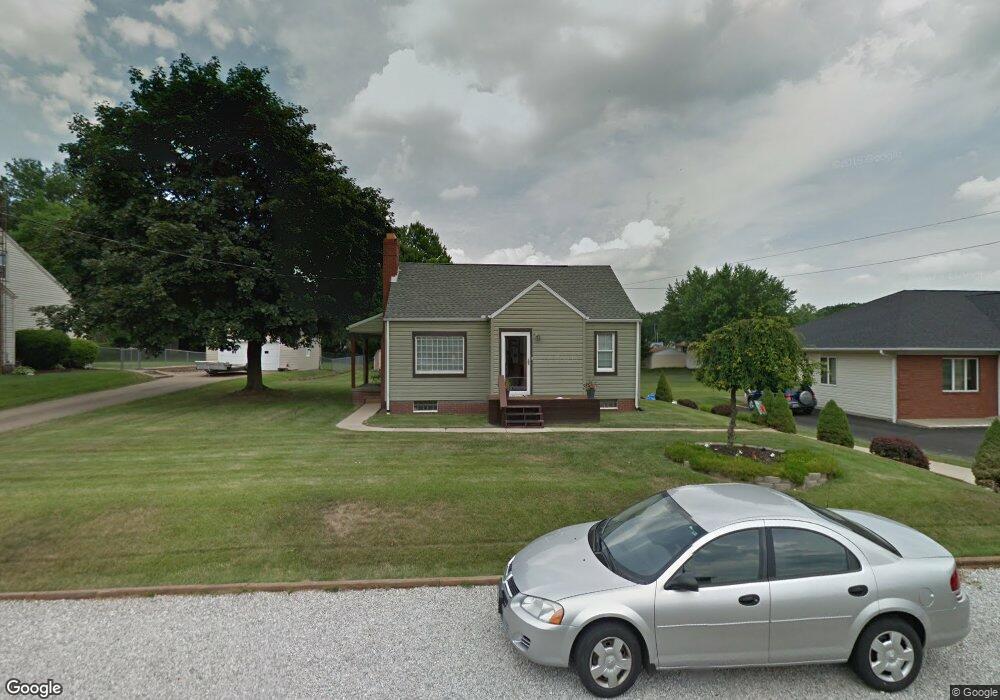
About This Home
This home is located at 4425 16th St NW, Canton, OH 44708 and is currently estimated at $201,716, approximately $178 per square foot. 4425 16th St NW is a home located in Stark County with nearby schools including Pfeiffer Intermediate School, Edison Middle School, and Perry High School.
Ownership History
Date
Name
Owned For
Owner Type
Purchase Details
Closed on
Mar 18, 2010
Sold by
Toney Kari K
Bought by
Henrich Paul D and Henrich Lori A
Current Estimated Value
Home Financials for this Owner
Home Financials are based on the most recent Mortgage that was taken out on this home.
Original Mortgage
$92,297
Outstanding Balance
$61,264
Interest Rate
5.01%
Mortgage Type
FHA
Estimated Equity
$140,452
Purchase Details
Closed on
Jan 29, 2002
Sold by
Hall Michelle S and Hall Michele S
Bought by
Toney Kari K
Home Financials for this Owner
Home Financials are based on the most recent Mortgage that was taken out on this home.
Original Mortgage
$72,300
Interest Rate
7.16%
Mortgage Type
FHA
Purchase Details
Closed on
Jul 22, 1994
Sold by
Carl Virginia F
Bought by
Hall Michelle S
Purchase Details
Closed on
Oct 21, 1992
Create a Home Valuation Report for This Property
The Home Valuation Report is an in-depth analysis detailing your home's value as well as a comparison with similar homes in the area
Home Values in the Area
Average Home Value in this Area
Purchase History
| Date | Buyer | Sale Price | Title Company |
|---|---|---|---|
| Henrich Paul D | $94,000 | Attorney | |
| Toney Kari K | $75,000 | -- | |
| Hall Michelle S | $45,000 | -- | |
| -- | -- | -- |
Source: Public Records
Mortgage History
| Date | Status | Borrower | Loan Amount |
|---|---|---|---|
| Open | Henrich Paul D | $92,297 | |
| Previous Owner | Toney Kari K | $72,300 | |
| Closed | Toney Kari K | $4,500 |
Source: Public Records
Tax History
| Year | Tax Paid | Tax Assessment Tax Assessment Total Assessment is a certain percentage of the fair market value that is determined by local assessors to be the total taxable value of land and additions on the property. | Land | Improvement |
|---|---|---|---|---|
| 2025 | -- | $58,840 | $17,710 | $41,130 |
| 2024 | -- | $58,840 | $17,710 | $41,130 |
| 2023 | $2,139 | $42,640 | $10,330 | $32,310 |
| 2022 | $2,150 | $42,640 | $10,330 | $32,310 |
| 2021 | $2,290 | $42,640 | $10,330 | $32,310 |
| 2020 | $2,087 | $37,280 | $9,100 | $28,180 |
| 2019 | $1,883 | $37,280 | $9,100 | $28,180 |
Source: Public Records
Map
Nearby Homes
- 1515 Manor Ave NW
- 0 W Park Ave NW
- 1933 Whipple Ave NW
- 4462 20th St NW
- 4659 14th St NW
- 4820 15th St NW
- 1101 Terrace Ave NW
- 4105 21st St NW
- 1010 Miles Ave NW
- 1536 Baycrest Dr NW
- 4431 7th St NW
- 3917 Crestwood St NW
- 4214 Ashwood St NW
- 3201 Mariners Island Dr NW Unit 3G
- 4632 5th St NW
- 2108 Devonshire Dr NW
- 4543 Saint James Cir NW Unit 258
- 0 Lakeside Ave NW
- 5030 12th St NW
- 4557 Saint James Cir NW
- 4433 16th St NW
- 1615 Whipple Ave NW
- 4441 16th St NW
- 1623 Whipple Ave NW
- 4424 17th St NW
- 4432 17th St NW
- 4422 16th St NW
- 4416 17th St NW
- 4447 16th St NW
- 4440 17th St NW
- 4432 16th St NW
- 1631 Whipple Ave NW
- 4449 16th St NW Unit 4449
- 1235 Whipple Ave NW
- 4440 16th St NW
- 1635 Whipple Ave NW
- 4446 17th St NW
- 4457 16th St NW
- 4448 16th St NW
- 4456 17th St NW
Your Personal Tour Guide
Ask me questions while you tour the home.