4425 Camden Ave Lorain, OH 44055
Estimated Value: $116,000 - $140,000
3
Beds
1
Bath
864
Sq Ft
$148/Sq Ft
Est. Value
About This Home
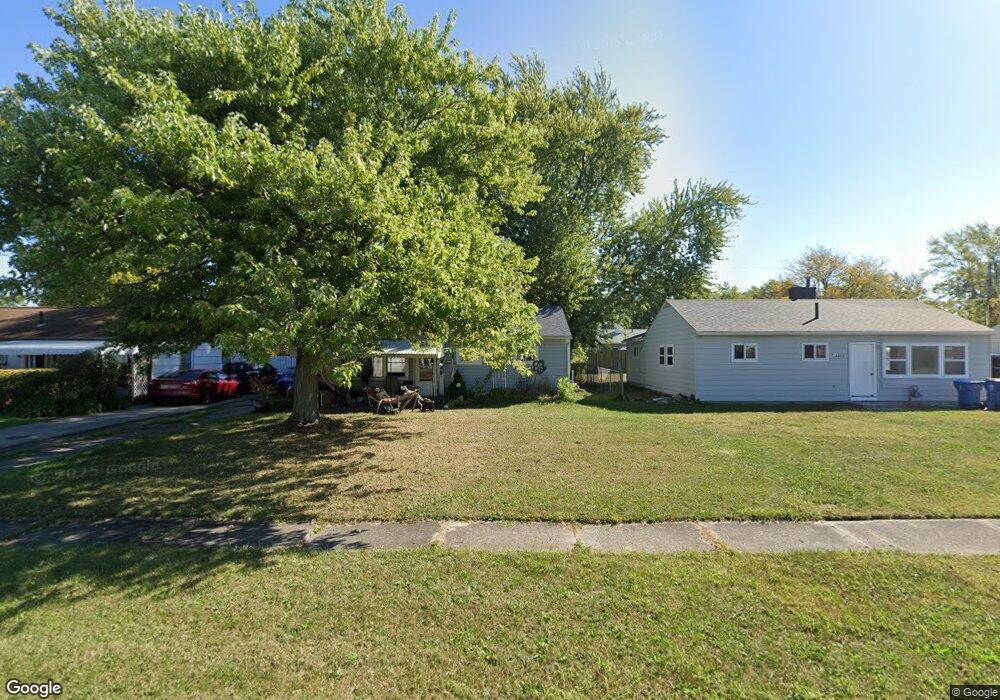
This home is located at 4425 Camden Ave, Lorain, OH 44055 and is currently estimated at $127,768, approximately $147 per square foot. 4425 Camden Ave is a home located in Lorain County with nearby schools including Helen Steiner Rice Elementary School, Southview Middle School, and Lorain High School.
Ownership History
Date
Name
Owned For
Owner Type
Purchase Details
Closed on
Oct 25, 2018
Sold by
Daymark Trustee Llc
Bought by
Cvf Iii Miortgage Loan Trust Ii
Current Estimated Value
Purchase Details
Closed on
Jun 3, 2015
Sold by
Oell Barnes Llc
Bought by
Daymark Trustee Llc and Daymark Master Trust
Purchase Details
Closed on
Mar 30, 2015
Sold by
U S Bank Na
Bought by
Odell Barnes Llc
Purchase Details
Closed on
May 13, 2014
Sold by
Hernandez Ernest
Bought by
Us Bank Na
Purchase Details
Closed on
Apr 26, 2006
Sold by
Figueroa Frank and Figueroa Alicia M
Bought by
Hernandez Ernest
Home Financials for this Owner
Home Financials are based on the most recent Mortgage that was taken out on this home.
Original Mortgage
$65,000
Interest Rate
6.42%
Mortgage Type
Fannie Mae Freddie Mac
Purchase Details
Closed on
Apr 22, 2004
Sold by
Figueroa Frank and Figueroa Alice
Bought by
Figueroa Frank and Figueroa Alice
Create a Home Valuation Report for This Property
The Home Valuation Report is an in-depth analysis detailing your home's value as well as a comparison with similar homes in the area
Home Values in the Area
Average Home Value in this Area
Purchase History
| Date | Buyer | Sale Price | Title Company |
|---|---|---|---|
| Cvf Iii Miortgage Loan Trust Ii | $42,900 | None Available | |
| Daymark Trustee Llc | $14,000 | First American | |
| Odell Barnes Llc | $11,500 | None Available | |
| Us Bank Na | $26,000 | None Available | |
| Hernandez Ernest | $65,000 | Real Living Title Agency Ltd | |
| Figueroa Frank | -- | -- |
Source: Public Records
Mortgage History
| Date | Status | Borrower | Loan Amount |
|---|---|---|---|
| Previous Owner | Hernandez Ernest | $65,000 |
Source: Public Records
Tax History Compared to Growth
Tax History
| Year | Tax Paid | Tax Assessment Tax Assessment Total Assessment is a certain percentage of the fair market value that is determined by local assessors to be the total taxable value of land and additions on the property. | Land | Improvement |
|---|---|---|---|---|
| 2024 | $1,303 | $30,839 | $9,982 | $20,857 |
| 2023 | $1,085 | $20,535 | $5,978 | $14,557 |
| 2022 | $1,076 | $20,535 | $5,978 | $14,557 |
| 2021 | $1,076 | $20,535 | $5,978 | $14,557 |
| 2020 | $997 | $16,530 | $4,810 | $11,720 |
| 2019 | $991 | $16,530 | $4,810 | $11,720 |
| 2018 | $1,024 | $16,530 | $4,810 | $11,720 |
| 2017 | $1,056 | $16,590 | $6,440 | $10,150 |
| 2016 | $1,047 | $16,590 | $6,440 | $10,150 |
| 2015 | $989 | $16,590 | $6,440 | $10,150 |
| 2014 | -- | $15,880 | $6,160 | $9,720 |
| 2013 | $912 | $15,880 | $6,160 | $9,720 |
Source: Public Records
Map
Nearby Homes
- 4543 Norfolk Ave
- 4651 Camden Ave
- 2456 E 37th St
- V/L Grove Ave
- 3934 Gary Ave
- 5278 Farr Ave
- 0 Vincent Ave
- 2374 E 37th St
- 2315 Homewood Dr
- 2323 Homewood Dr
- 5193 Liberty Ave
- 3690 Gary Ave
- VL Ridgewood St
- 2500 E 32nd St
- 2440 E 32nd St
- V/L Eschtruth St
- V/L Rear Land Unit 1
- V/L Rear Land Unit 2
- 2333 E 33rd St
- 2312 E 32nd St
- 4429 Camden Ave
- 4421 Camden Ave
- 4433 Camden Ave
- 4417 Camden Ave
- 4424 Norfolk Ave
- 4428 Norfolk Ave
- 4420 Norfolk Ave
- 4432 Norfolk Ave
- 4437 Camden Ave
- 4413 Camden Ave
- 4422 Camden Ave
- 4426 Camden Ave
- 4416 Norfolk Ave
- 4418 Camden Ave
- 4436 Norfolk Ave
- 4430 Camden Ave
- 4414 Camden Ave
- 4503 Camden Ave
- 4409 Camden Ave
- 4434 Camden Ave