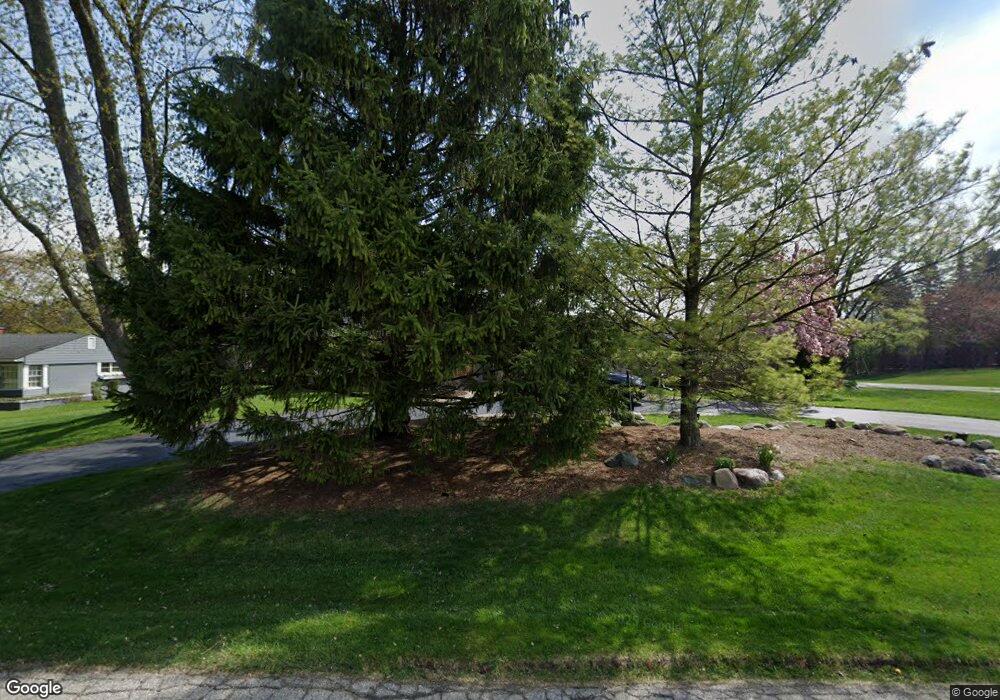
4425 Charing Way Bloomfield Hills, MI 48304
Estimated Value: $633,000 - $660,000
3
Beds
4
Baths
2,287
Sq Ft
$284/Sq Ft
Est. Value
About This Home
This home is located at 4425 Charing Way, Bloomfield Hills, MI 48304 and is currently estimated at $649,564, approximately $284 per square foot. 4425 Charing Way is a home located in Oakland County with nearby schools including Eastover Elementary School, Bloomfield Hills High School, and Academy of Sacred Heart.
Ownership History
Date
Name
Owned For
Owner Type
Purchase Details
Closed on
Jan 20, 2015
Sold by
Papa Michael and Papa Tracy R
Bought by
Revocable Living Trust Of Michael Papa and Papa Tracy R
Current Estimated Value
Purchase Details
Closed on
Apr 29, 2009
Sold by
Sherman John Charles and Sherman Pauline M
Bought by
Papa Michael
Purchase Details
Closed on
Jun 25, 2004
Sold by
Lindros Loretta and Lindros Roy
Bought by
Sherman John Charles and Sherman Pauline Marie
Home Financials for this Owner
Home Financials are based on the most recent Mortgage that was taken out on this home.
Original Mortgage
$279,900
Interest Rate
6.39%
Mortgage Type
Purchase Money Mortgage
Create a Home Valuation Report for This Property
The Home Valuation Report is an in-depth analysis detailing your home's value as well as a comparison with similar homes in the area
Home Values in the Area
Average Home Value in this Area
Purchase History
| Date | Buyer | Sale Price | Title Company |
|---|---|---|---|
| Revocable Living Trust Of Michael Papa | -- | None Available | |
| Papa Michael | $239,000 | Interstate Title Inc | |
| Sherman John Charles | $349,900 | Devon Title Agency |
Source: Public Records
Mortgage History
| Date | Status | Borrower | Loan Amount |
|---|---|---|---|
| Previous Owner | Sherman John Charles | $34,950 | |
| Previous Owner | Sherman John Charles | $279,900 |
Source: Public Records
Tax History Compared to Growth
Tax History
| Year | Tax Paid | Tax Assessment Tax Assessment Total Assessment is a certain percentage of the fair market value that is determined by local assessors to be the total taxable value of land and additions on the property. | Land | Improvement |
|---|---|---|---|---|
| 2024 | $2,937 | $246,460 | $0 | $0 |
| 2023 | $2,842 | $221,890 | $0 | $0 |
| 2022 | $5,553 | $211,760 | $0 | $0 |
| 2021 | $5,513 | $204,650 | $0 | $0 |
| 2020 | $2,599 | $201,590 | $0 | $0 |
| 2019 | $4,989 | $195,950 | $0 | $0 |
| 2018 | $5,228 | $188,290 | $0 | $0 |
| 2017 | $5,194 | $183,620 | $0 | $0 |
| 2016 | $6,626 | $163,720 | $0 | $0 |
| 2015 | -- | $149,380 | $0 | $0 |
| 2014 | -- | $130,250 | $0 | $0 |
| 2011 | -- | $121,290 | $0 | $0 |
Source: Public Records
Map
Nearby Homes
- 4389 Charing Way
- 280 Canterbury Rd
- 433 Whippers In Ct
- 3826 Lakecrest Dr
- 4890 Charing Cross Rd
- 4731 Haddington Dr
- 170 Kirkwood Ct
- 1335 Trowbridge Rd
- 796 Rock Spring Rd
- 33 Boulder Ln Unit 2
- 1012 Stratford Ln Unit 64
- 20 Hidden Ridge
- 60 Kingsley Manor Dr
- 0000 Brookdale Rd
- 2991 Lanergan Dr
- 3539 Walbri Dr
- 1048 Satterlee Rd
- 175 Bridgeview Dr
- 2840 Bolingbroke Dr
- 3370 BlooMcRest Dr
- 4420 Squirrel Rd
- 4415 Queens Way
- 4440 Queens Way
- 4400 Squirrel Rd
- 4430 Queens Way
- 4448 Squirrel Rd
- 4401 Charing Way
- 4380 Squirrel Rd
- 4420 Queens Way
- 4410 Charing Way
- 4395 Queens Way
- 4394 Charing Way
- 4435 Squirrel Rd
- 4371 Queens Way
- 4396 Queens Way
- 4385 Squirrel Rd
- 4425 Squirrel Rd
- 4382 Queens Way
- 4370 Charing Way
- 376 Wattles Rd