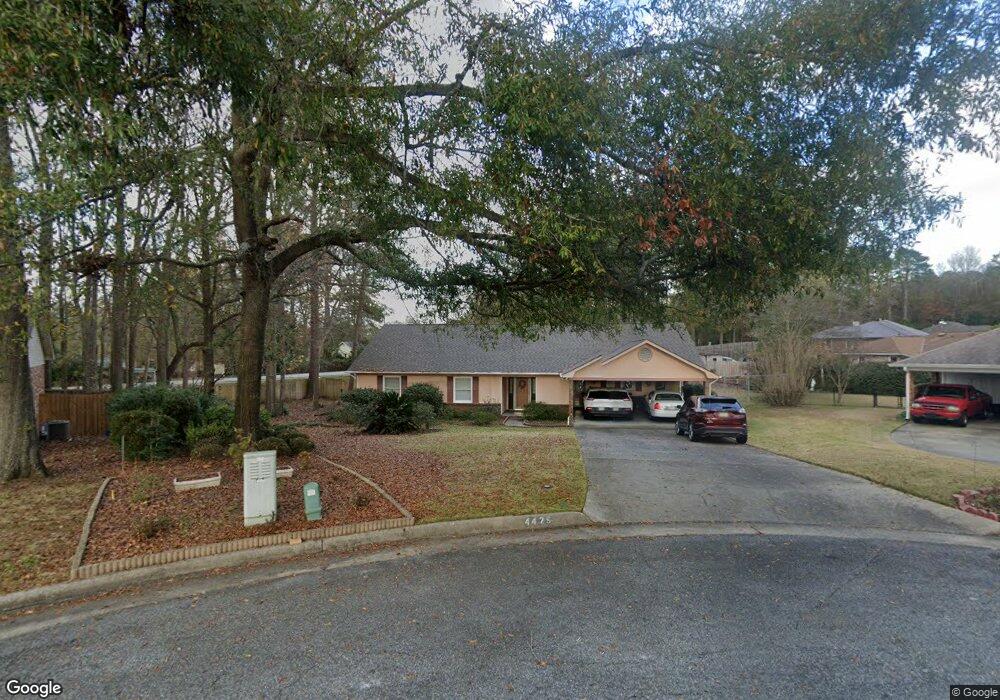
4425 Mereworth Ct Columbus, GA 31907
Estimated Value: $231,000 - $243,402
3
Beds
3
Baths
1,910
Sq Ft
$123/Sq Ft
Est. Value
About This Home
This home is located at 4425 Mereworth Ct, Columbus, GA 31907 and is currently estimated at $235,351, approximately $123 per square foot. 4425 Mereworth Ct is a home located in Muscogee County with nearby schools including Reese Road Leadership Academy, Fort Middle School, and Hardaway High School.
Ownership History
Date
Name
Owned For
Owner Type
Purchase Details
Closed on
Oct 19, 2023
Sold by
Mummert Melanie
Bought by
David Britni J
Current Estimated Value
Home Financials for this Owner
Home Financials are based on the most recent Mortgage that was taken out on this home.
Original Mortgage
$176,400
Outstanding Balance
$172,970
Interest Rate
7.18%
Mortgage Type
New Conventional
Estimated Equity
$62,381
Purchase Details
Closed on
Oct 18, 2023
Sold by
Springate Nancy
Bought by
David Britni J
Home Financials for this Owner
Home Financials are based on the most recent Mortgage that was taken out on this home.
Original Mortgage
$176,400
Outstanding Balance
$172,970
Interest Rate
7.18%
Mortgage Type
New Conventional
Estimated Equity
$62,381
Purchase Details
Closed on
Apr 11, 2023
Sold by
Hollomon Lewis Olin
Bought by
Mummert Melanie and Springate Nancy
Create a Home Valuation Report for This Property
The Home Valuation Report is an in-depth analysis detailing your home's value as well as a comparison with similar homes in the area
Home Values in the Area
Average Home Value in this Area
Purchase History
| Date | Buyer | Sale Price | Title Company |
|---|---|---|---|
| David Britni J | -- | None Listed On Document | |
| David Britni J | $196,000 | None Listed On Document | |
| Mummert Melanie | -- | None Listed On Document |
Source: Public Records
Mortgage History
| Date | Status | Borrower | Loan Amount |
|---|---|---|---|
| Open | David Britni J | $176,400 |
Source: Public Records
Tax History Compared to Growth
Tax History
| Year | Tax Paid | Tax Assessment Tax Assessment Total Assessment is a certain percentage of the fair market value that is determined by local assessors to be the total taxable value of land and additions on the property. | Land | Improvement |
|---|---|---|---|---|
| 2025 | $3,069 | $78,400 | $9,760 | $68,640 |
| 2024 | $3,069 | $78,400 | $9,760 | $68,640 |
| 2023 | $3,019 | $76,644 | $10,360 | $66,284 |
| 2022 | $712 | $61,300 | $10,360 | $50,940 |
| 2021 | $705 | $56,984 | $10,360 | $46,624 |
| 2020 | $705 | $56,984 | $10,360 | $46,624 |
| 2019 | $709 | $56,984 | $10,360 | $46,624 |
| 2018 | $709 | $56,984 | $10,360 | $46,624 |
| 2017 | $713 | $56,984 | $10,360 | $46,624 |
| 2016 | $717 | $45,064 | $7,281 | $37,783 |
| 2015 | $288 | $45,064 | $7,281 | $37,783 |
| 2014 | $289 | $45,064 | $7,281 | $37,783 |
| 2013 | -- | $45,064 | $7,281 | $37,783 |
Source: Public Records
Map
Nearby Homes
- 4524 Hedingham Ln
- 10 Conisburgh Ct
- 4133 Pickering Dr
- 4120 Fairview Dr
- 4807 Fairview Dr
- 4017 River Rock Way
- 2 Hidden Woods Ct
- 4709 Rowland Ave
- 4047 Sealy Ln
- 4520 Marci Ct
- 4635 Delfair Dr
- 4004 Tifton Dr
- 4813 Rowland Ct
- 3935 Tifton Dr
- 3053 Reese Rd
- 4975 Glacier Dr
- 4439 Florence Dr
- 2951 Florence Dr
- 4317 Byron St
- 4355 Byron St
- 4431 Mereworth Ct
- 4417 Mereworth Ct
- 4354 Deanery Ct
- 4501 Gatewood Ave
- 4424 Mereworth Ct
- 4409 Mereworth Ct
- 4346 Deanery Ct
- 4343 Deanery Ct
- 4418 Mereworth Ct
- 4509 Gatewood Ave
- 4502 Gatewood Ave
- 3 Hedingham Ct
- 4510 Northwood Ave
- 4410 Mereworth Ct
- 4401 Mereworth Ct
- 2 Hedingham Ct
- 4510 Gatewood Ave
- 4515 Gatewood Ave
- 4335 Deanery Ct
- 4338 Deanery Ct