NOT LISTED FOR SALE

Estimated Value: $253,000 - $324,000

3 Beds
3 Baths
1,957 Sq Ft
$146/Sq Ft Est. Value

Last Sold March 11, 2023

Last sale price $240,000 $123 Per Sq Ft

Est. 19% increase in value since last sale

Current estimated payment $1,788/month

About This Home

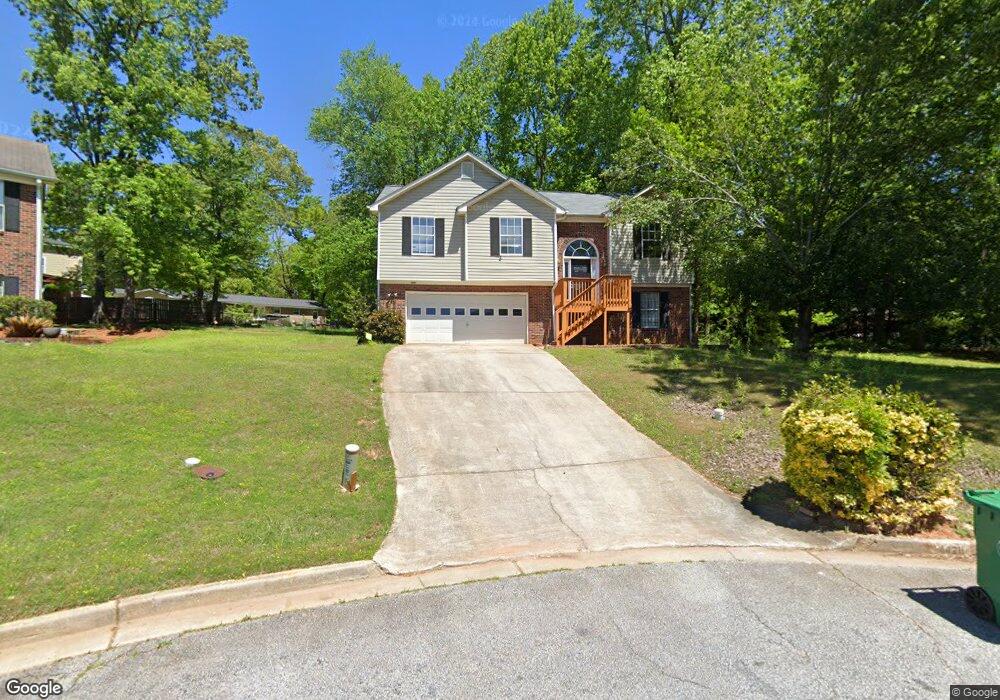
Perfect home for a first time investor or a handy homeowner. With a little TLC this home will be a perfect rental or a place to call home!

Ownership History

Date Name Owned For Owner Type

Purchase Details

Listed on
Feb 17, 2023
Closed on
Mar 7, 2023
Sold by
Cook Felecia R
Bought by
Tassobshirazi Majid and Aussie Sharareh
Seller's Agent
Tim Hardeman
Hardeman Real Estate
Buyer's Agent
Zaven Najarian
Neighborhood Realty LLC
List Price
$235,000
Sold Price
$240,000
Premium/Discount to List
$5,000
2.13%
Views
69
Current Estimated Value
$284,908

Home Financials for this Owner

Home Financials are based on the most recent Mortgage that was taken out on this home.
Estimated Appreciation
$44,908
Avg. Annual Appreciation
6.34%

Purchase Details

Closed on
Nov 10, 1999
Sold by
Rdp Properties Inc
Bought by
Cook Kenneth R and Cook Felecia R

Home Financials for this Owner

Home Financials are based on the most recent Mortgage that was taken out on this home.
Original Mortgage
$128,418
Interest Rate
7.7%
Mortgage Type
VA
Source: Public Records

Range of Values:

--
Value Increase
--
Percent Increase
--
Adjusted for Inflation
Collateral Analytics

Collateral Analytics Collateral Analytics AVMs (Automated Valuation Model) employ a number of statistical approaches combined with neighborhood-specific comparable selection guarantees the most up-to-date and precise valuations.

Not Available

Collateral Analytics does not have data for the current month. Please view the chart for historical values.

ICE

ICE Mortgage Technology ICE Mortgage Technology’s AVM (Automated Valuation Model) is a state-of-the-art online residential property valuation tool that provides a quick and accurate estimate of the value of almost any home in the U.S.

Not Available

ICE Mortgage Technology does not have data for the current month. Please view the chart for historical values.

First American

First American First American Data & Analytics’ next-generation AVM combines unrivaled data assets with a blended ensemble of valuation models to produce highly accurate, reliable valuations you can trust.

Not Available

First American does not have data for the current month. Please view the chart for historical values.

Quantarium

Quantarium Quantarium’s valuation service, repeatedly proven the industry’s most accurate and comprehensive, is supercharged with a self-learning and auto-tuning AI engine that continually becomes smarter and more accurate as it processes daily inputs from the industry’s leading RE data lake.

Not Available

Quantarium does not have data for the current month. Please view the chart for historical values.

Average Value
Not Available
List Price
Sold Price
Create a Home Valuation Report for This Property
The Home Valuation Report is an in-depth analysis detailing your home's value as well as a comparison with similar homes in the area

Home Values in the Area

Source: Public Records

Average Home Value in this Area


Source: Public Records

Purchase History

Date Buyer Sale Price Title Company
Tassobshirazi Majid $240,000 --
Cook Kenneth R $125,900 --
Source: Public Records

Mortgage History

Date Status Borrower Loan Amount
Previous Owner Cook Kenneth R $128,418
Source: Public Records

Property History

Date Event Price List to Sale Price per Sq Ft Prior Sale
03/11/2023 03/11/23 Sold $240,000 +2.1% $123 / Sq Ft View Prior Sale
02/21/2023 02/21/23 Pending -- -- --
02/17/2023 02/17/23 For Sale $235,000 -- $120 / Sq Ft

Tax History Compared to Growth

Source: Public Records

Tax History

Year Tax Paid Tax Assessment Tax Assessment Total Assessment is a certain percentage of the fair market value that is determined by local assessors to be the total taxable value of land and additions on the property. Land Improvement
2025 $3,486 $111,760 $12,000 $99,760
2024 $3,266 $96,000 $8,200 $87,800
2023 $3,266 $95,880 $9,200 $86,680
2022 $2,890 $86,400 $9,200 $77,200
2021 $2,406 $72,320 $9,200 $63,120
2020 $2,218 $66,720 $9,200 $57,520
2019 $1,863 $57,000 $9,200 $47,800
2018 $1,512 $54,000 $9,200 $44,800
2017 $1,583 $47,240 $9,200 $38,040
2016 $1,345 $41,480 $9,200 $32,280
2014 $921 $29,120 $9,200 $19,920
Source: Public Records

Agents Affiliated with this Home

  • Section Image
  • Section Image
See All Agents

Map