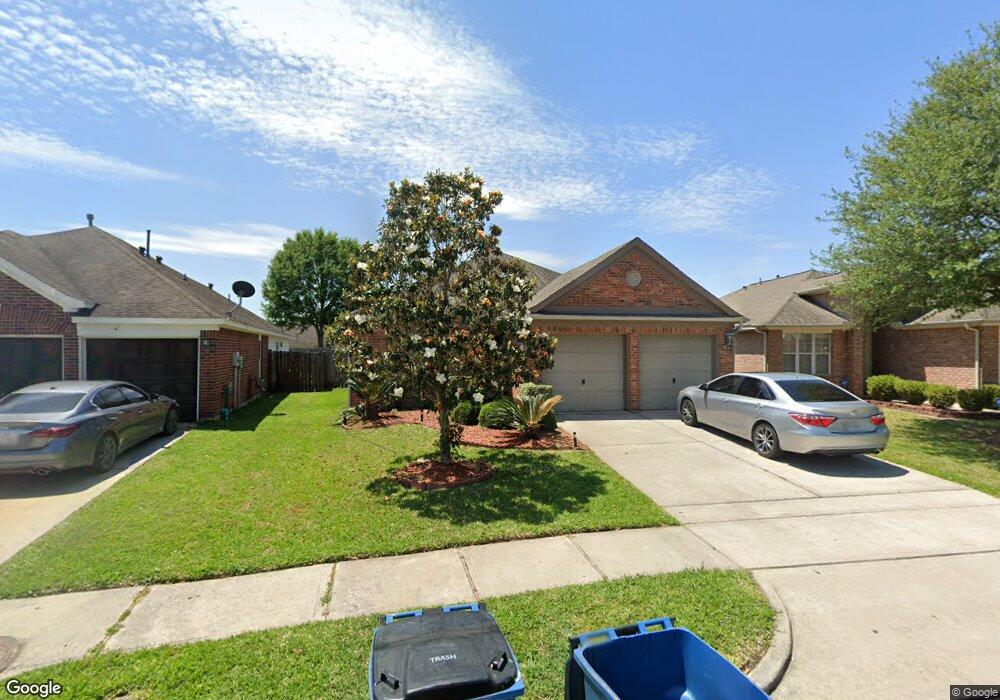
4426 Sunlit Pass Loop Humble, TX 77396
Park Lakes NeighborhoodEstimated Value: $256,286 - $271,000
4
Beds
2
Baths
1,910
Sq Ft
$139/Sq Ft
Est. Value
About This Home
This home is located at 4426 Sunlit Pass Loop, Humble, TX 77396 and is currently estimated at $265,822, approximately $139 per square foot. 4426 Sunlit Pass Loop is a home located in Harris County with nearby schools including Park Lakes Elementary School, Humble Middle School, and Humble High School.
Ownership History
Date
Name
Owned For
Owner Type
Purchase Details
Closed on
Nov 5, 2012
Sold by
Zepeda Jesus Gustavo
Bought by
Dang Loc B and Nguyen May T
Current Estimated Value
Home Financials for this Owner
Home Financials are based on the most recent Mortgage that was taken out on this home.
Original Mortgage
$90,250
Outstanding Balance
$15,451
Interest Rate
2.76%
Mortgage Type
New Conventional
Estimated Equity
$250,371
Purchase Details
Closed on
Apr 24, 2012
Sold by
Price Zepeda Shelley
Bought by
Zepeda Jesus Gustavo
Purchase Details
Closed on
Sep 5, 2007
Sold by
Perry Homes Llc
Bought by
Zepeda Jesus Gustavo
Home Financials for this Owner
Home Financials are based on the most recent Mortgage that was taken out on this home.
Original Mortgage
$139,511
Interest Rate
6.7%
Mortgage Type
Purchase Money Mortgage
Create a Home Valuation Report for This Property
The Home Valuation Report is an in-depth analysis detailing your home's value as well as a comparison with similar homes in the area
Home Values in the Area
Average Home Value in this Area
Purchase History
| Date | Buyer | Sale Price | Title Company |
|---|---|---|---|
| Dang Loc B | -- | None Available | |
| Zepeda Jesus Gustavo | -- | None Available | |
| Zepeda Jesus Gustavo | -- | Chicago Title |
Source: Public Records
Mortgage History
| Date | Status | Borrower | Loan Amount |
|---|---|---|---|
| Open | Dang Loc B | $90,250 | |
| Previous Owner | Zepeda Jesus Gustavo | $139,511 |
Source: Public Records
Tax History Compared to Growth
Tax History
| Year | Tax Paid | Tax Assessment Tax Assessment Total Assessment is a certain percentage of the fair market value that is determined by local assessors to be the total taxable value of land and additions on the property. | Land | Improvement |
|---|---|---|---|---|
| 2025 | $5,040 | $250,266 | $27,683 | $222,583 |
| 2024 | $5,040 | $257,390 | $27,683 | $229,707 |
| 2023 | $5,040 | $257,390 | $27,683 | $229,707 |
| 2022 | $5,907 | $235,460 | $27,683 | $207,777 |
| 2021 | $5,780 | $193,479 | $27,683 | $165,796 |
| 2020 | $5,676 | $191,829 | $24,155 | $167,674 |
| 2019 | $5,449 | $177,208 | $24,155 | $153,053 |
| 2018 | $1,839 | $146,000 | $24,155 | $121,845 |
| 2017 | $4,983 | $146,000 | $24,155 | $121,845 |
| 2016 | $4,983 | $146,000 | $24,155 | $121,845 |
| 2015 | $3,938 | $146,000 | $24,155 | $121,845 |
| 2014 | $3,938 | $125,962 | $24,155 | $101,807 |
Source: Public Records
Map
Nearby Homes
- 4326 Sunlit Pass Loop
- 4503 Early Autumn Ct
- 4306 Granite Park Way
- 4611 Coral Rose Ct
- 4610 Early Autumn Ct
- 9511 Lakeway View Ln
- 9314 Tracelawn Ct
- 9406 Fawn Park Ct
- 9202 Tracelawn Ct
- 9543 Alabaster Oaks Ln
- 9414 Gerber Ln
- 9702 Layton Ridge Dr
- 15819 Nutcracker Ct
- 9710 Lansing Meadows Dr
- 4045, 4111, 4119,412 Wilson Rd
- 00 Wilson Rd
- 15910 Plover Ct
- 15907 Plover Ct
- 8114 Audubon Forest Dr
- 8006 White Swan Dr
- 4430 Sunlit Pass Loop
- 4422 Sunlit Pass Loop
- 4434 Sunlit Pass Loop
- 9238 Red Castle Ln
- 4438 Sunlit Pass Loop
- 9227 Sunlit Park Dr
- 9231 Sunlit Park Dr
- 9234 Red Castle Ln
- 9223 Sunlit Park Dr
- 9235 Sunlit Park Dr
- 4427 Sunlit Pass Loop
- 4431 Sunlit Pass Loop
- 4423 Sunlit Pass Loop
- 9219 Sunlit Park Dr
- 4442 Sunlit Pass Loop
- 9239 Sunlit Park Dr
- 4435 Sunlit Pass Loop
- 9230 Red Castle Ln
- 9215 Sunlit Park Dr
- 4419 Sunlit Pass Loop