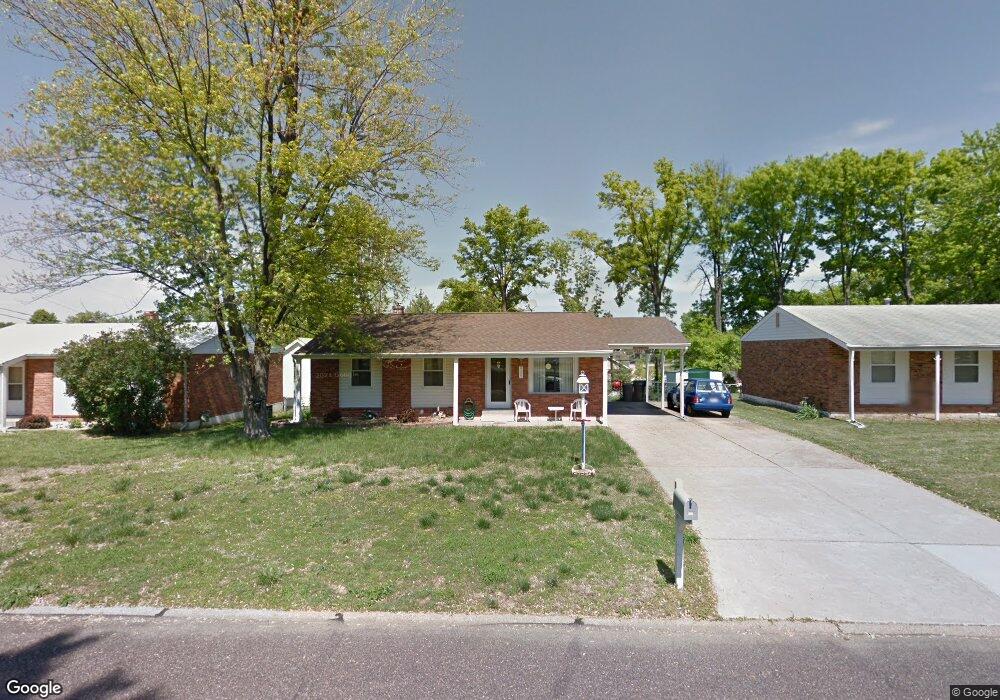
4427 Brooktop Ln Saint Louis, MO 63128
Estimated Value: $200,000 - $273,000
3
Beds
2
Baths
1,054
Sq Ft
$225/Sq Ft
Est. Value
About This Home
This home is located at 4427 Brooktop Ln, Saint Louis, MO 63128 and is currently estimated at $237,596, approximately $225 per square foot. 4427 Brooktop Ln is a home located in St. Louis County with nearby schools including Hagemann Elementary School, Washington Middle School, and Mehlville High School.
Ownership History
Date
Name
Owned For
Owner Type
Purchase Details
Closed on
Apr 20, 2021
Sold by
Wingenbach David and Wingenbach Mary
Bought by
Maxeiner Brandon A
Current Estimated Value
Home Financials for this Owner
Home Financials are based on the most recent Mortgage that was taken out on this home.
Original Mortgage
$112,000
Outstanding Balance
$101,203
Interest Rate
3.05%
Mortgage Type
New Conventional
Estimated Equity
$136,393
Purchase Details
Closed on
Nov 17, 2017
Sold by
Wingenbach Family Living Trust and Wingenbach Ferdinand J
Bought by
Wingenbach Ferdinand J
Purchase Details
Closed on
Aug 4, 2014
Sold by
Wingenbach Ferdinand J
Bought by
Wingenbach Family Living Trust
Purchase Details
Closed on
Jul 28, 1998
Sold by
Wingenbach Ferdinand J
Bought by
Wingenbach Ferdinand J and Wingenbach Laverne
Create a Home Valuation Report for This Property
The Home Valuation Report is an in-depth analysis detailing your home's value as well as a comparison with similar homes in the area
Home Values in the Area
Average Home Value in this Area
Purchase History
| Date | Buyer | Sale Price | Title Company |
|---|---|---|---|
| Maxeiner Brandon A | $120,000 | Continental Title Holding Co | |
| Wingenbach Ferdinand J | -- | None Available | |
| Wingenbach Family Living Trust | -- | None Available | |
| Wingenbach Ferdinand J | -- | -- |
Source: Public Records
Mortgage History
| Date | Status | Borrower | Loan Amount |
|---|---|---|---|
| Open | Maxeiner Brandon A | $112,000 |
Source: Public Records
Tax History Compared to Growth
Tax History
| Year | Tax Paid | Tax Assessment Tax Assessment Total Assessment is a certain percentage of the fair market value that is determined by local assessors to be the total taxable value of land and additions on the property. | Land | Improvement |
|---|---|---|---|---|
| 2025 | $2,632 | $44,630 | $15,160 | $29,470 |
| 2024 | $2,632 | $39,060 | $11,780 | $27,280 |
| 2023 | $2,632 | $39,060 | $11,780 | $27,280 |
| 2022 | $1,960 | $29,510 | $11,780 | $17,730 |
| 2021 | $1,897 | $29,510 | $11,780 | $17,730 |
| 2020 | $1,893 | $28,010 | $10,110 | $17,900 |
| 2019 | $1,887 | $28,010 | $10,110 | $17,900 |
| 2018 | $1,688 | $22,580 | $8,440 | $14,140 |
| 2017 | $1,686 | $22,580 | $8,440 | $14,140 |
| 2016 | $1,819 | $23,410 | $8,440 | $14,970 |
| 2015 | $1,671 | $23,410 | $8,440 | $14,970 |
| 2014 | $1,876 | $26,070 | $6,060 | $20,010 |
Source: Public Records
Map
Nearby Homes
- 5251 Tuscan Chase Ct
- 5134 Butler Hill Ct
- 5417 Morningdale Place
- 4374 Bristol View Ct
- 4357 Bristol View Ct
- 4508 Frederickton Ct
- 4540 Butler Hill Rd
- 4523 Beaver Brook Ct
- 4921 Kerth Rd
- 5161 Butler Bend Dr
- 4209 Consett Dr
- 5131 Butler Bend Dr
- 5524 Providence Place Dr
- 4716 Medalton Way
- 5600 Wickershire Ln
- 5942 Hawkins Fuchs Rd
- 5714 Shining Day Place
- 13266 East Ln
- 5102 Peyton Place Ct
- 6006 Grand Marnier Dr
- 4423 Brooktop Ln
- 4431 Brooktop Ln
- 4419 Brooktop Ln
- 4435 Brooktop Ln
- 5256 S Glen Ct
- 5250 S Glen Ct
- 5285 Tuscan Chase Ct
- 5301 Morningdale Place
- 4415 Brooktop Ln
- 4439 Brooktop Ln
- 5825 Tuscan Chase Ct
- 4420 Brooktop Ln
- 5281 Tuscan Chase Ct
- 4436 Brooktop Ln
- 5284 Tuscan Chase Ct
- 4411 Brooktop Ln
- 4416 Brooktop Ln
- 4443 Brooktop Ln
- 5280 Tuscan Chase Ct
- 5275 Tuscan Chase Ct